*** NOTE: ALL INFORMATION IS ACCURATE AT DATE OF PUBLISHING ***
If you have a website, and you haven’t yet looked at Microsoft Clarity, I suggest you check it out. I’ve written a bunch of posts and created videos on the subject for you to get started. As and when I notice new functionality, I’ll add to the list of learning resources for anyone wanting to know how to use it for their own site. One of the items that has now become available is the scroll heatmaps (which were previously listed as ‘Coming soon’). I covered the click heatmaps in a previous post, but now let’s look at these new scroll heatmaps, showing how far your users have scrolled down the page.
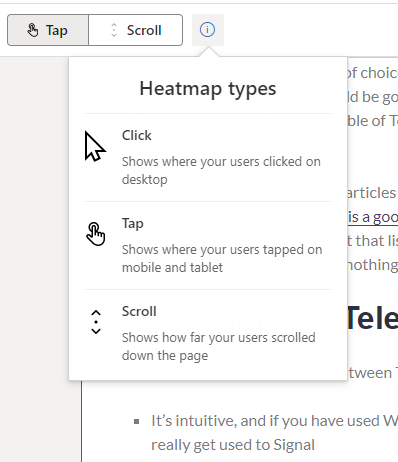
When reviewing a heatmap, click on the little information button at the top, then click on Scroll. This will change the heatmap you are reviewing, and display the scroll type instead of the default click heatmap.
You will see a new overlay appear over the image of the page you are reviewing. The top will have red covering it, which indicates the hottest heatmap section where all of your users that visited the page will have viewed. This makes sense as when the page loads, the top is displayed (unless you have any anchor tags which could take someone to the middle of your page instead). So expect the top part to be red.
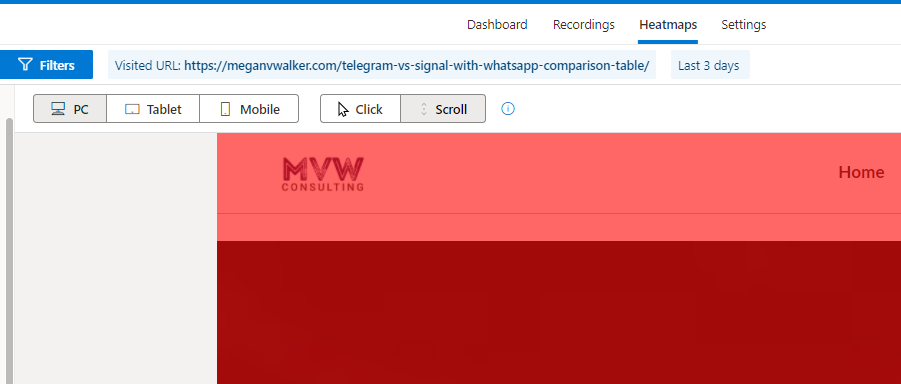
As you scroll down, you will see the colour change all the way from red, through orange, yellow, greens and then finally dark blue. This indicates cold, where the fewest number of visitors actually scrolled too. Here we can see that 74.91% of visitors reached this point on the page.

We can swap between the desktop visitors, then tablet and also mobile users who visited the page.

Finally, the left hand panel will break down the percentage of the page that was scrolled down, how many visitors that was, and the percentage of the overall visitors to that page.

Reviewing the scroll heatmaps is useful to see how far your visitors are getting down a page. Do you lose most people before they have reached 20 or 30% of your page? Or is the page of interest to them, and they are getting pretty much down to the bottom the majority of the time? Happy to see that this feature has finally been launched, and will be reviewing my scroll heatmaps with interest.
You can watch a video on this here.
Check out the latest post:
Set A Business Process Flow Stage With Custom Page
This is just 1 of 572 articles. You can browse through all of them by going to the main blog page, or navigate through different categories to find more content you are interested in. You can also subscribe and get new blog posts emailed to you directly.