
*** NOTE: ALL INFORMATION IS ACCURATE AT DATE OF PUBLISHING ***
After finding this great article online for creating 3D charts in CRM, I wondered what else I could change. Start off by Exporting the chart. The FetchXML will download. Open it up in an editing tool, Notepad works fine.
There are quite a few elements that can be adjusted, and many articles online. By changing the following elements, the chart can be transformed into a much more interesting and stylish graphical representation of your data.
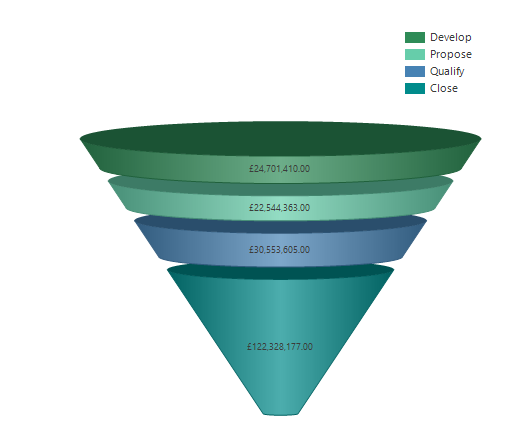
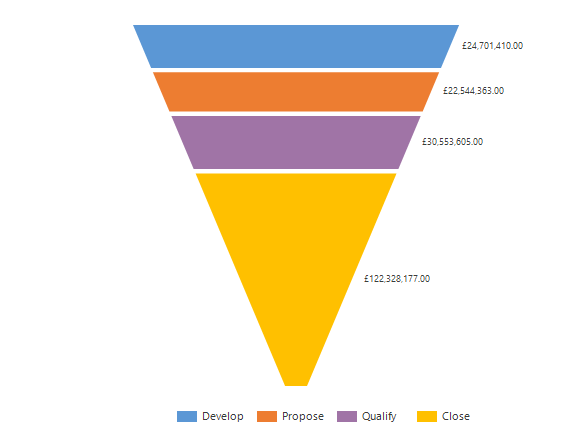 3D – change from false to true: <Area3DStyle Enable3D=”true” />
Chart Palette – change from none to one of 12 valid options: Chart Palette=”SeaGreen”
Legend Alignment – can be Near, Center or Far: Legend Alignment=”Far”
Legend Style – can be Style, Column, Row or Table: LegendStyle=”Column”
Legend Docking – can be top, left, bottom or right: Docking=”top”
Funnel Label – can be inside or outside: FunnelLabelStyle=Inside
Save the XML, then use the Import Chart function to create the new chart.
Check out the latest post:
Use Custom Event Registration Questions To Branch Your Journeys In Customer Insights
This is just 1 of 603 articles. You can browse through all of them by going to the main blog page, or navigate through different categories to find more content you are interested in.