
I was looking through the acquisition reports for my website when I noticed a channel I hadn’t seen before: AI Assistant (released in May 2026). GA4 was now separating visits from tools such as ChatGPT and Gemini rather than leaving them mixed in with my other referral traffic. Seeing the number was interesting, but it immediately raised several more useful questions. Which AI tools were sending people? Which articles were they finding? And, most importantly, what did those visitors do when they arrived?
GA4 is measuring people who click a link from a recognised AI assistant and arrive on the website. So, for anyone just getting their answers from AI and NOT clicking, they aren’t being tracked (should be obvious 🙄). I noticed it when looking at one of the standard reports, with just a little bit of traffic coming through as AI Assistant.
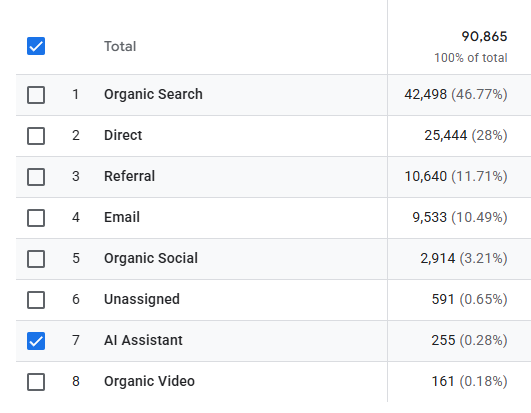
Google now assigns recognised visits to:
- Default channel group:
AI Assistant - Medium:
ai-assistant - Campaign:
(ai-assistant)
Visualising The Data
Now we know we can find this data (nothing you need to do to ‘turn it on’), how can we set up reports or gain insight in to the traffic? It’s interesting to see WHICH AI tool is bringing people to your site, and maybe then which one is bringing the most engaged audience members who then carry on and look at other pages on your site and not just one blog post.
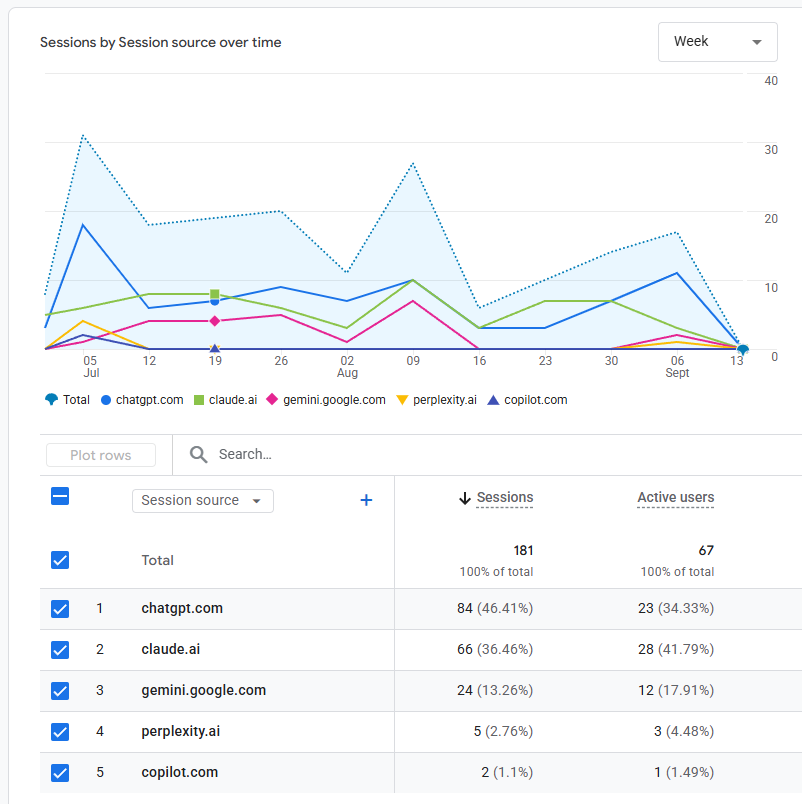
If you’re totally new to GA4, this might not be the right post to start with. However, if you’ve at least got it set up and are tracking your site data, you should be able to follow along and get some reports and and overview set up, giving you something like this at the end.
Creating Reports In GA4
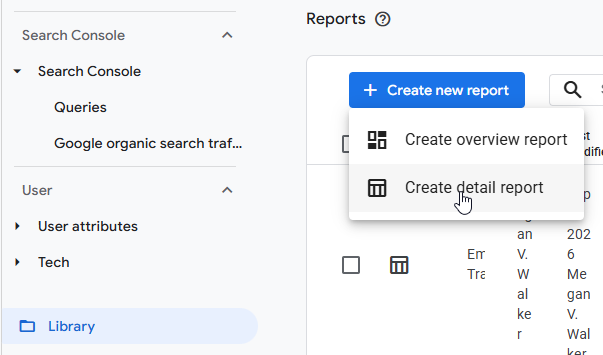
We can create two kinds of reports. A detail report and an overview report. First comes the detail report, which we can then add cards to. The cards can then be added to the overview report for a quick snapshot. We will create three detail reports to start with. From the navigation, go to Library, then click on Create new report, then Create detail report.
AI Traffic Detail Report
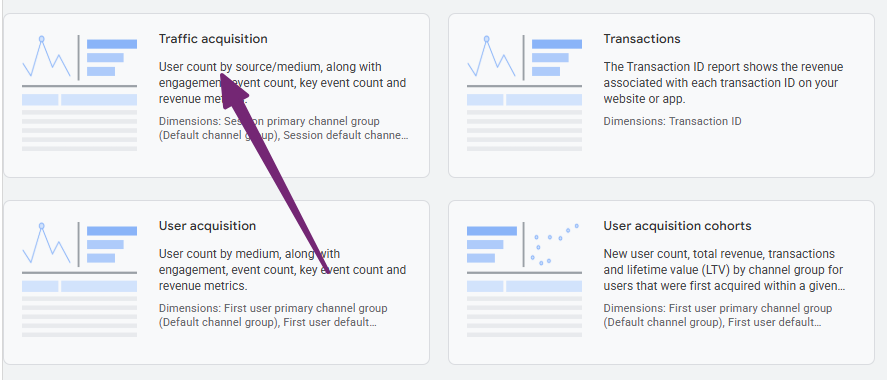
After clicking Create detail report, select the Traffic acquisition template as your starting point.
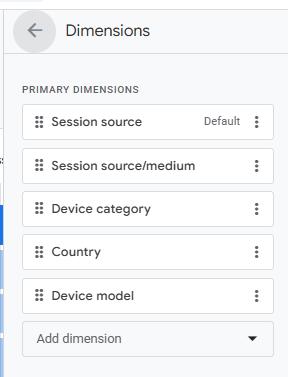
Customising the report, click in to the dimensions and select something like Session source, Session source/medium, Device category and country. Make sure Session source is selected as the default.
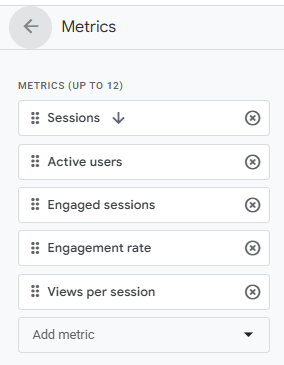
Then do the same with the metrics.
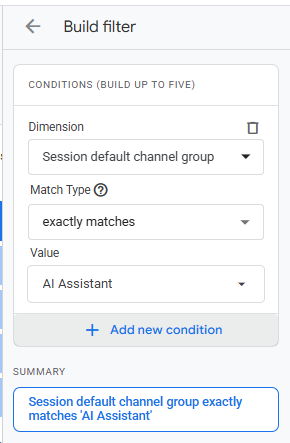
The report summary is important as this is where we define that we only want the AI Traffic data. Using the Session default channel group, we can make sure we only show where it exactly matches AI Assistant.
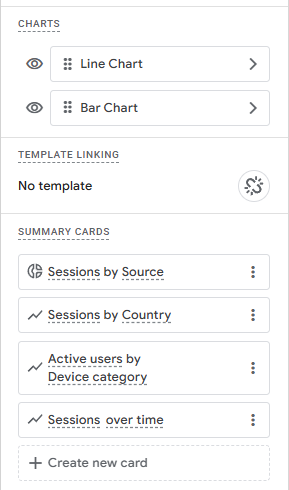
You can then determine which charts will show on the report, and also create summary cards based on the same report filter (which can be used on the final overview report).
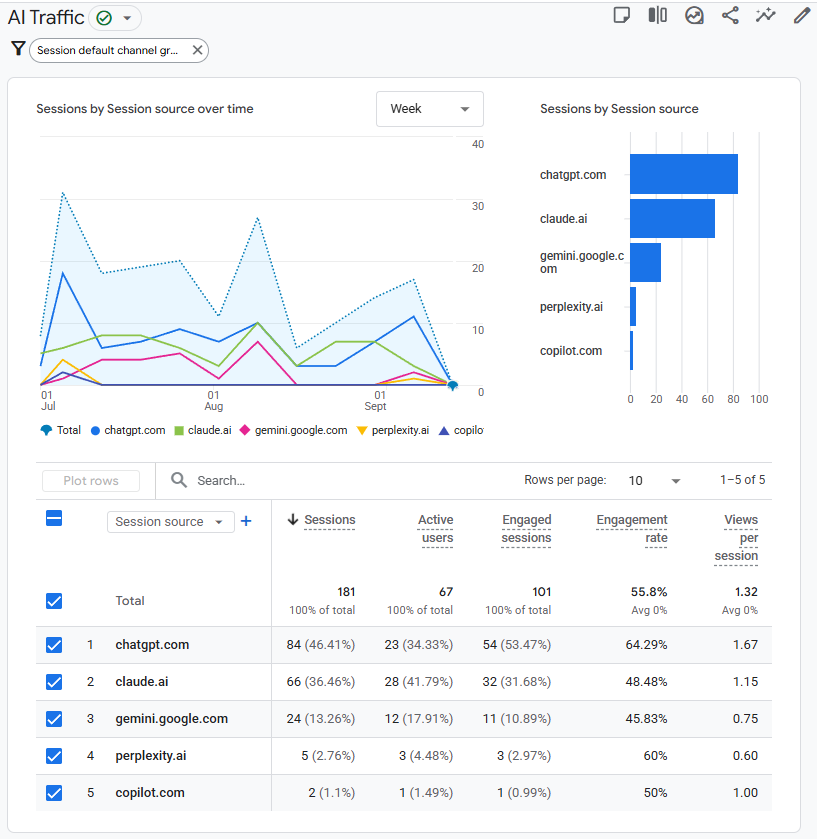
Our AI Traffic report can show which AI assistants send traffic, and which send the most engaged visitors.
AI Landing Pages Report
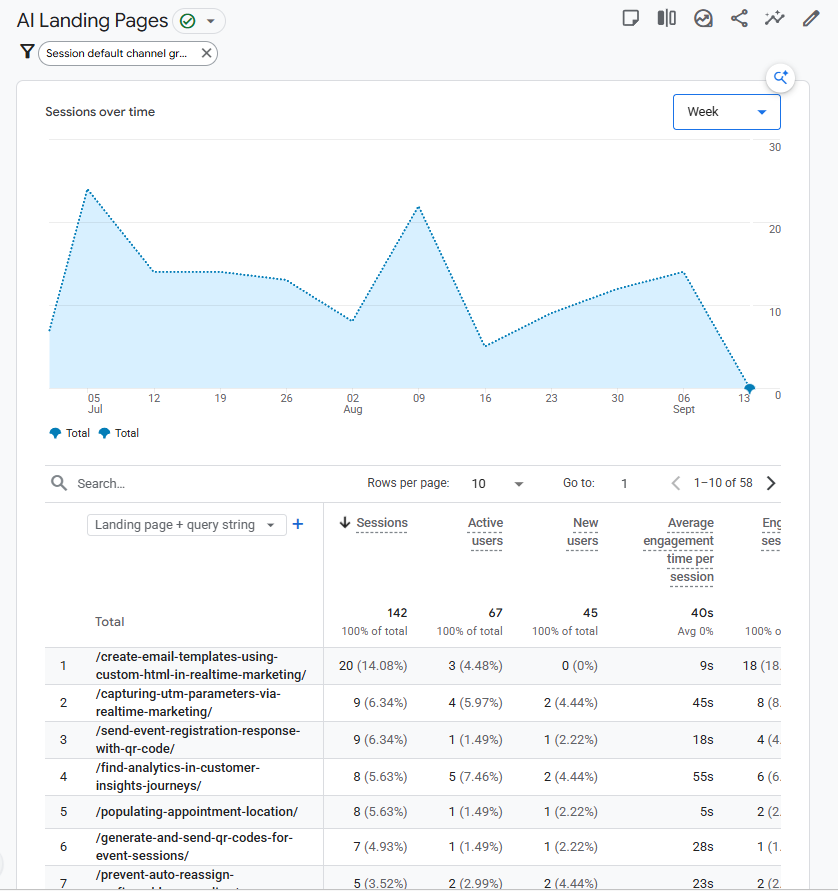
Create a second report of the same kind. You can use the Landing page template as your starting point. Add these dimensions: Landing page + query string, Page title, Session source and make Landing page + query string the default dimension. Then add these metrics: Session, Active users, New users, Average engagement time per session, Engaged sessions and Engagement rate.
Apply the same report filter as above where the Session default channel group exactly matches AI Assistant.
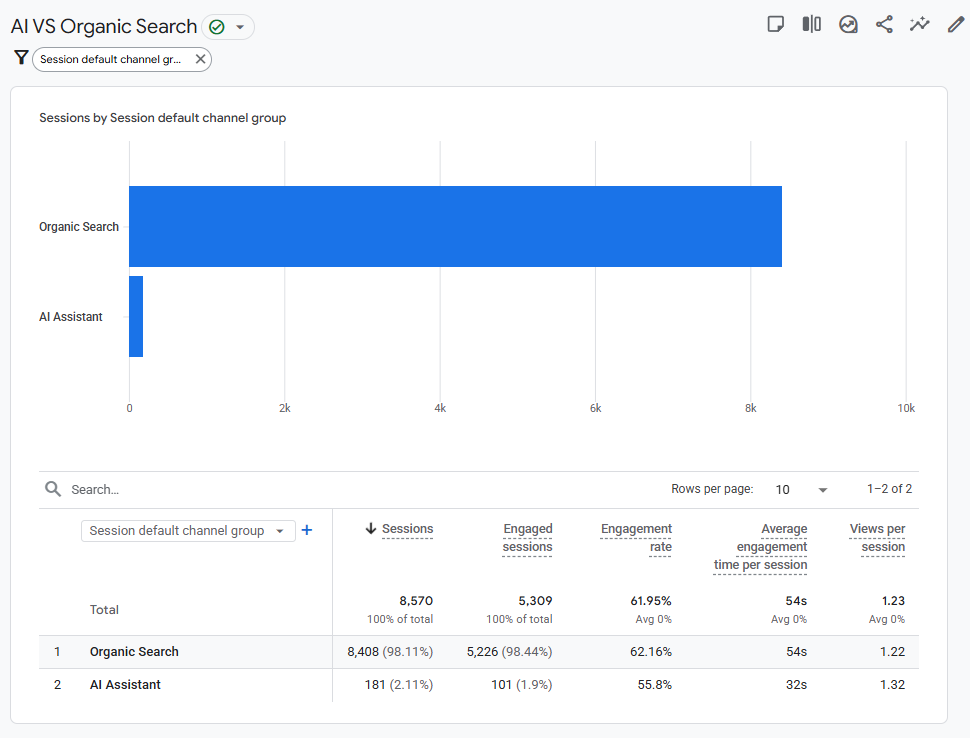
AI vs Organic Search
Last one (you get the picture and can create your own in addition), create another template from the Traffic acquisition template, and set the default dimension as Session default channel group. Use metrics like Sessions, Engaged sessions, Engagement rate, Average engagement time per session, views per session and key events. For the filter, you can use a regex to just keep the data where the session default channel group is either AI Assistant or Organic Search.
^(AI Assistant|Organic Search)$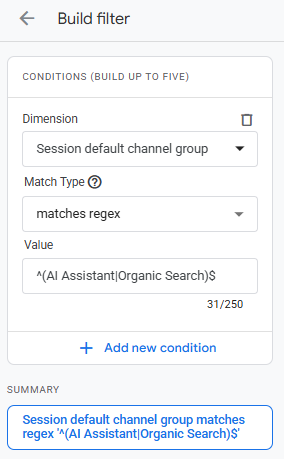
Now we can compare the visits coming from an AI tool versus traffic where someone has done a search using something like Google. This will be a really interesting one to review over time to see how this grows or reduces on either channel.
AI Traffic Overview
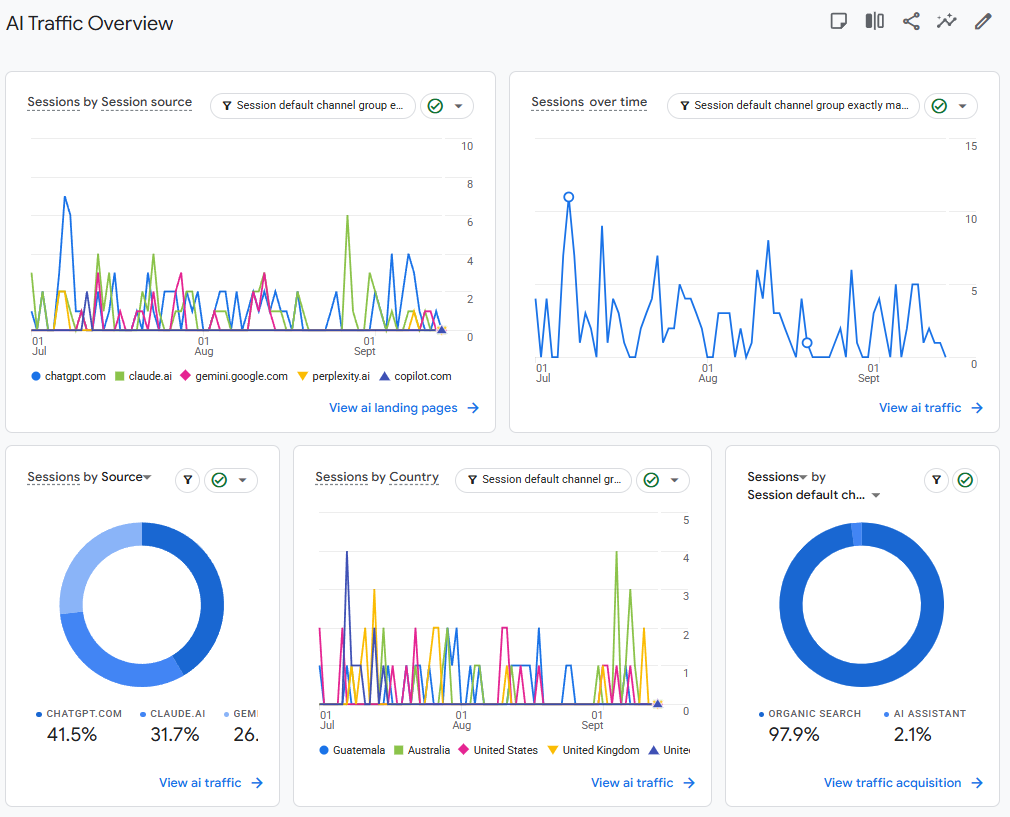
You can use all of those reports independently, or you can create an overview report and combine cards from all of the other reports in one place.
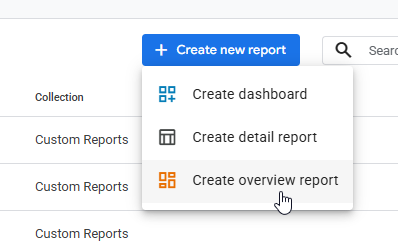
Make sure you give the report a logical name then from the right panel, you can search for and add cards to the report. This give a nice snapshot which you can then jump to and get more information from each of the reports in more detail.
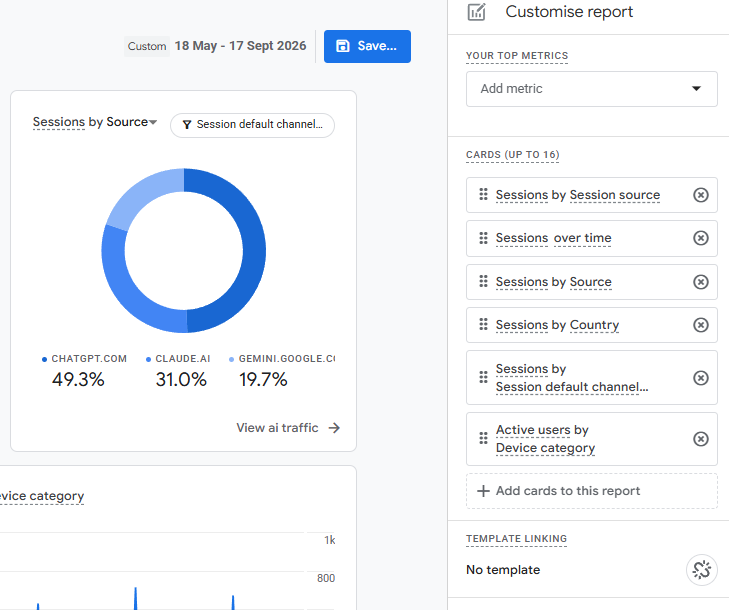
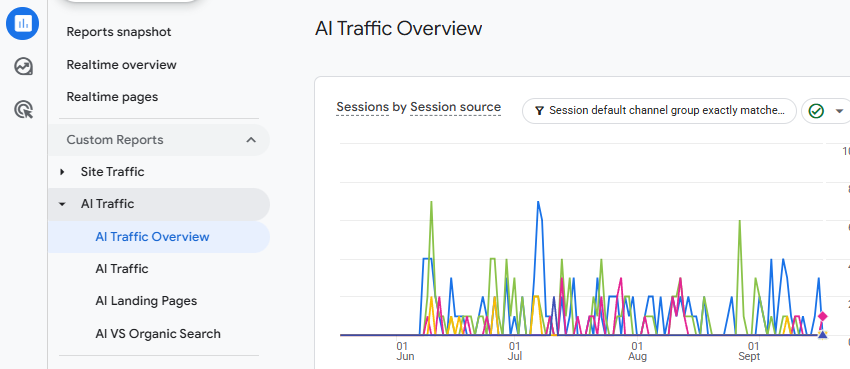
My overview report looks like this. Might take a bit of trial and error in picking the correct cards, but I was happy with this as a first attempt.
Adding Reports To The Navigation
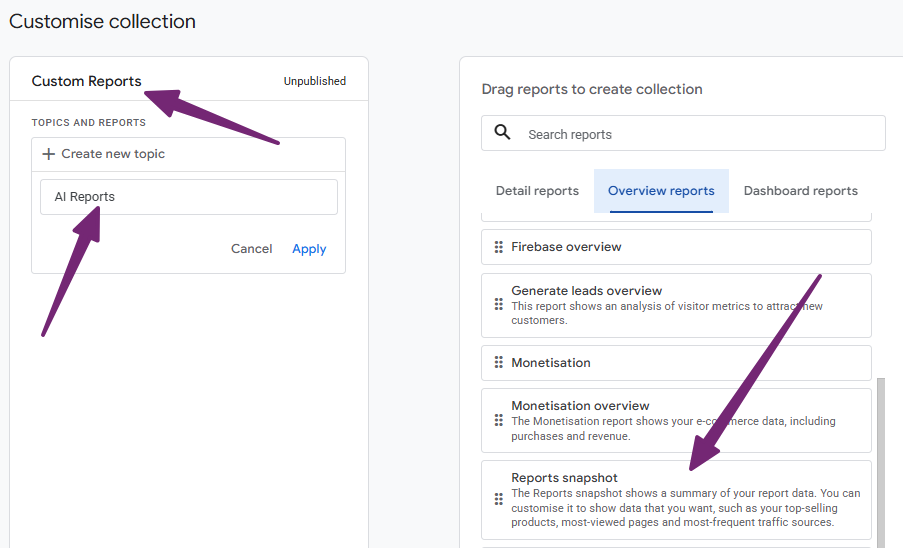
Lastly, how about making it a bit easier to access your lovely new reports in one place? Go to the library in the navigation, then click on Create new collection.
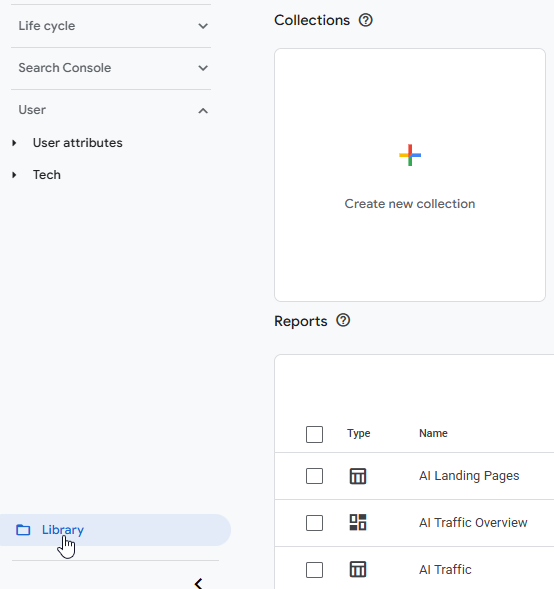
If you haven’t already, create a collection called Custom Reports. If you have, you should know what to do, and can just edit your existing custom collection. Add a topic for AI Reports, then find your reports to drag across to the new topic.
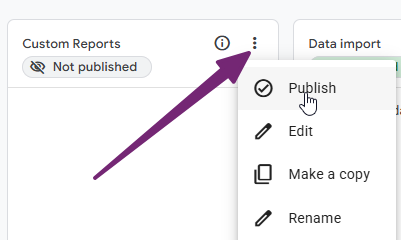
Go back to the Library, find the collection and publish it.
You might need to refresh, but you should then see your custom collection along with the new topic for AI traffic or reports that you added.
Hope this has been useful. I am keen to see how this data changes over time as the traffic with this channel group is still pretty new in terms of grouping things in this way. Have you started seeing it in your own GA4 environments?






Leave a Reply