
Creating reports in GA4 is useful for monitoring AI traffic, but Explorations let you dig deeper into what is actually happening. You can bring together dimensions and metrics that normally sit across different reports, then filter, compare and visualise the data in more flexible ways. In this article, I’ll show you how to create an AI Traffic Content Exploration to see which AI assistants are sending visitors, which content they are finding and how those visitors behave when they arrive.
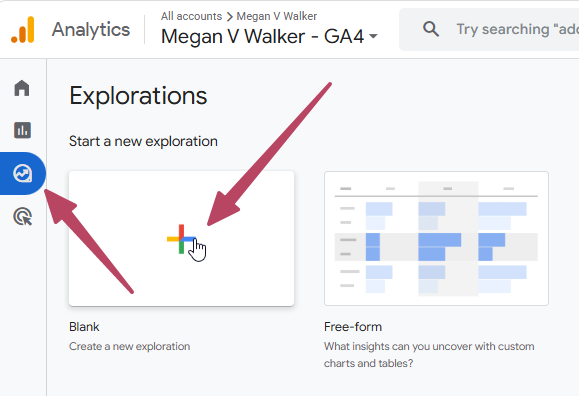
If you’ve never created an exploration before, I’ll walk through the initial steps, then show you some of the tabs I added to my exploration. To get started, go to Explore, then choose the blank option to create a new exploration.
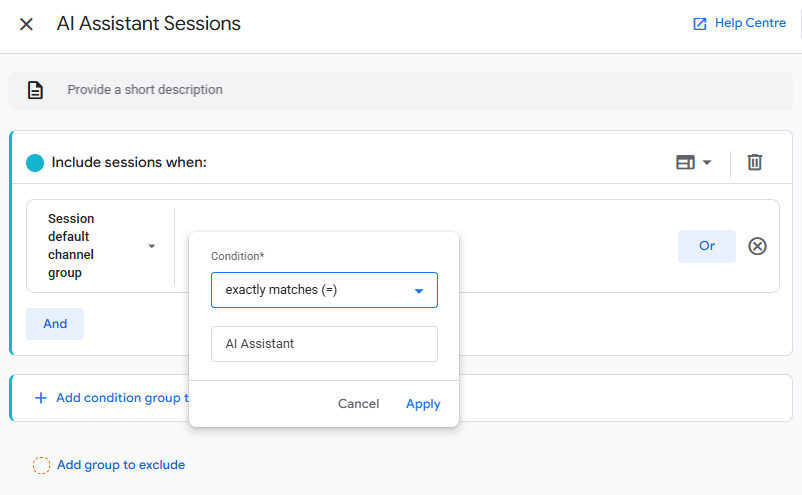
We then need a new session segment that can help us filter the traffic to just use sessions where the session default channel group matches exactly ‘AI Assistant’. Give the session a name then save and apply it to your exploration.
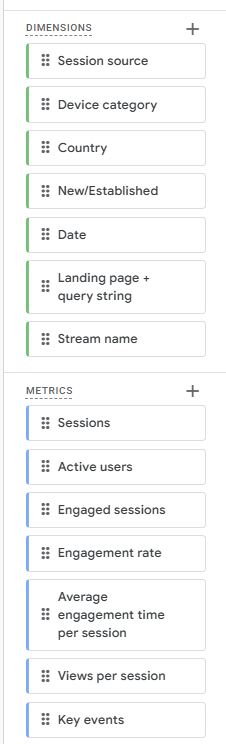
You can then add the sessions and metrics that are important to you in the variables section. These are just some suggestions.
Then we start building out the rows, using session source.
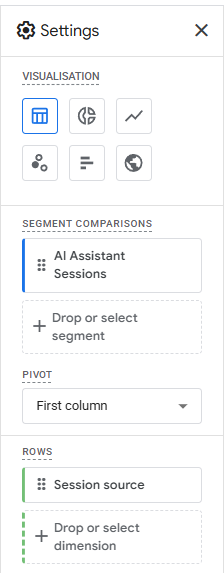
Scrolling down we can then determine which values should be added to the table for us to review and analyse. You’ll then start to see your visualisation populate and can quickly see where you might want to add or swap out some of your values, or even change the dimensions used on the rows.
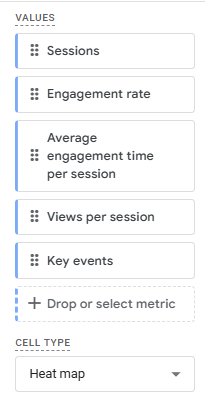
We can then start with the initial tab provided, and then move on to create additional tabs.
AI Traffic Visualisation
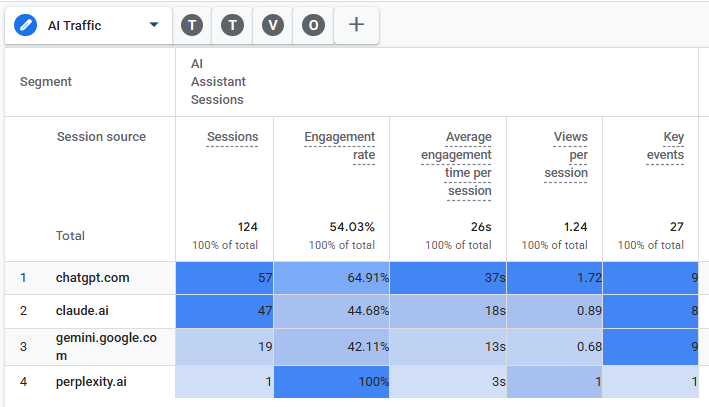
The following will give you a nice heatmap, showing you immediately the source sending the most traffic, but understanding it isn’t necessarily producing the highest engagement or most key events.
- Technique: Free form
- Visualisation: Table
- Segment: AI Assistant Sessions (the one you created earlier)
- Rows: Session source dimension
- Values: Sessions, Engagement rate, Average engagement time per session, Views per session, Key events
- Cell type: Heat map
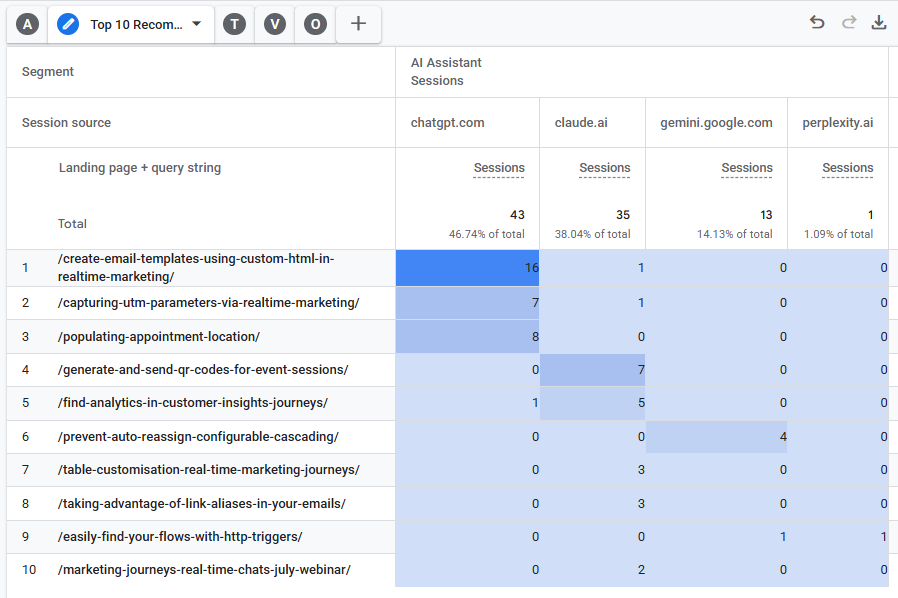
Top 10 Recommended Visualisation
This will help you understand which content AI is recommending and can help to understand if different assistants appear to be favouring different pieces of content. We can see the sessions broken out by different AI assistants by blog post (or URL).
- Technique: Free form
- Visualisation: Table
- Segment: AI Assistant Sessions (the one you created earlier)
- Rows: Landing page + query string
- Columns: Session source
- Values: Sessions
- Cell type: Heat map
- Filters: You may wish to add filters to filter out things like query string does not exactly match / or /blog/ to filter out specific landing pages
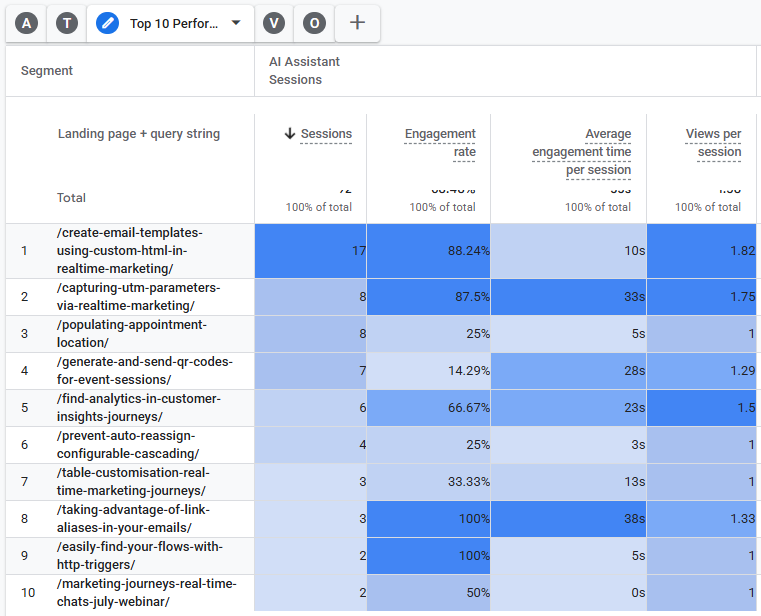
Top 10 Performance Visualisation
Similar to the visualisation above, but this separates popularity from quality and shows if content has a high number of sessions and high engagement, high sessions but low engagement, or low sessions but high engagement (among other examples).
- Technique: Free form
- Visualisation: Table
- Segment: AI Assistant Sessions (the one you created earlier)
- Rows: Landing page + query string
- Values: Sessions, Engagement rate, Average engagement time per session, Views per session
- Cell type: Heat map
- Filters: You may wish to add filters to filter out things like query string does not exactly match / or /blog/ to filter out specific landing pages
Visitor Journey Visualisation
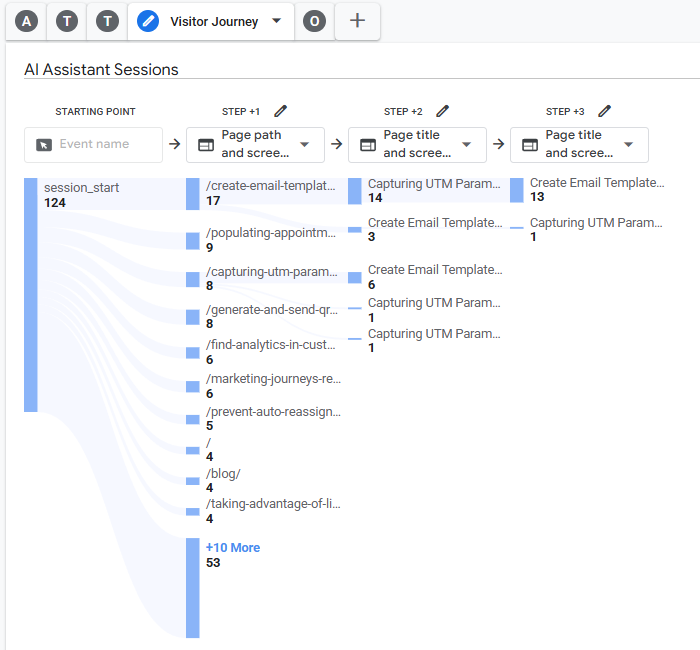
This helps us understand the starting point of a visitor who has come to the site via an AI Assistant and where they began their journey, then subsequent pages or events they continued on to. This helps see if people land then read another article, trigger a form or subscription event, or leave after reading one page.
- Technique: Path exploration
- Segment: AI Assistant Sessions (the one you created earlier)
- Node Type: Event name, Page title and screen name, Page title and screen class, Page path and screen class
- Values: Event count
Organic VS AI Visualisation
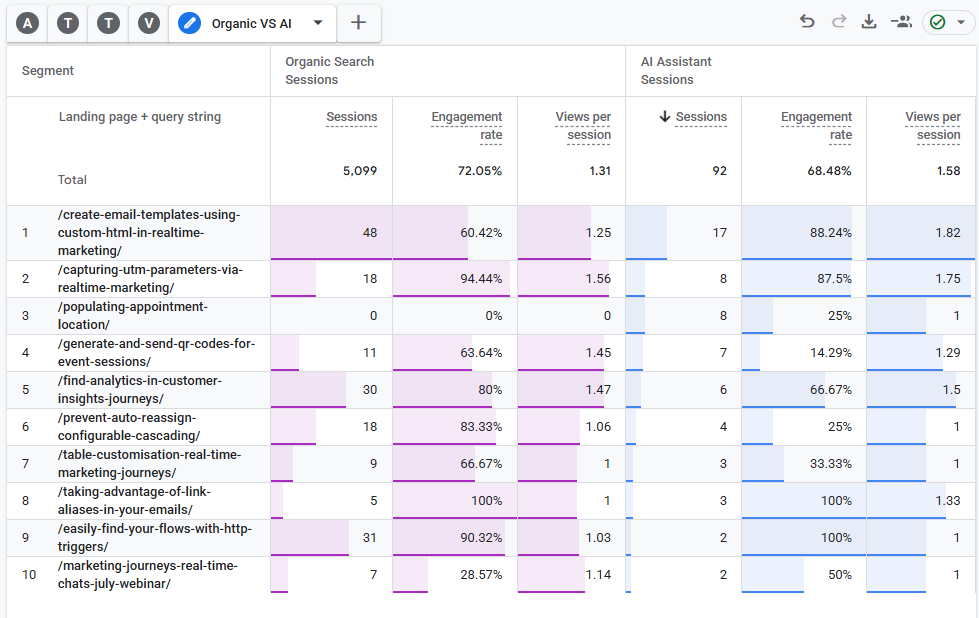
This visualisation will let you compare how AI visitors and search (organic) visitors behave once they reach the same content. It might help see if AI visitors spend more or less time on the page, or they are sent to different articles etc.
- Technique: Free form
- Visualisation: Table
- Segment: AI Assistant Sessions (the one you created earlier), and create a second one for Organic Search Sessions (filtered where Session default channel group exactly matches Organic Search)
- Rows: Landing page + query string
- Values: Sessions, Engagement rate, Views per session
- Cell type: Bar chart
- Filters: You may wish to add filters to filter out things like query string does not exactly match / or /blog/ to filter out specific landing pages
Location Visits Visualisation
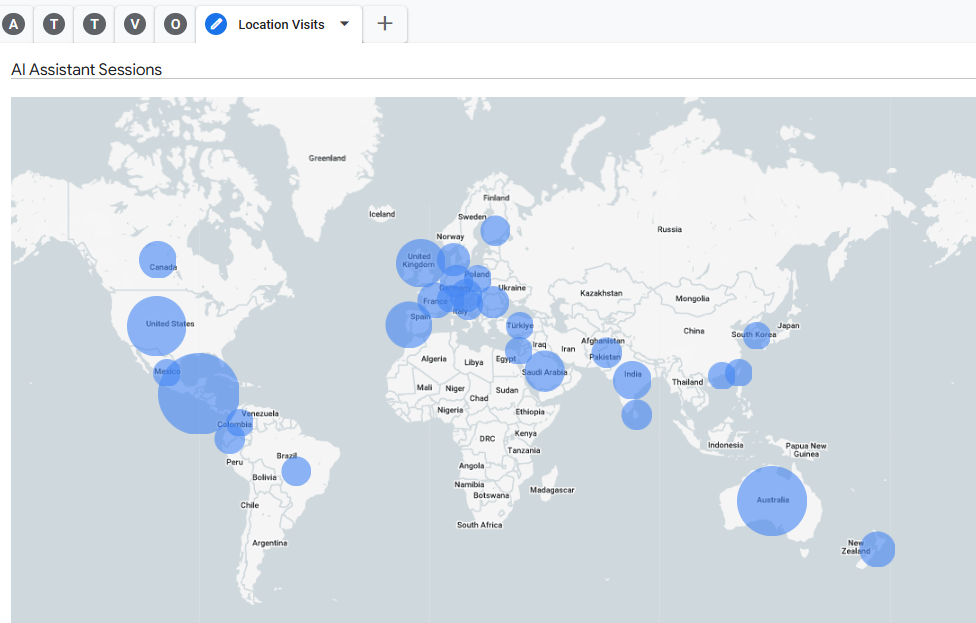
We can also show the AI Assistant sessions by Country (or Region or City if you prefer). Changing the values to use Engagement rate instead of sessions could help show where your most engaged visitors are coming from, rather than just the most, helping understand the strongest location regarding your readers or customers.
- Technique: Free form
- Visualisation: Geo map
- Segment: AI Assistant Sessions (the one you created earlier)
- Geo Breakdown: Country
- Values: Sessions
Unlike custom reports, an Exploration cannot be published to the main Reports navigation. It remains available from the Explore area, although it can be shared with other users of the GA4 property. I hope this helps! It’s been interesting reviewing the data and trying to understand where traffic is coming from and how engaged those visitors are when they come from AI.




Leave a Reply