*** NOTE: ALL INFORMATION IS ACCURATE AT DATE OF PUBLISHING ***
As someone with a passion and interest in analytics, websites and marketing, I’ve written about Microsoft Clarity a few times. It’s a fantastic free tool from Microsoft, and rather than a replacement for Google Analytics, should be used in conjunction to understand your website user behaviour and how they are interacting with your site. It provides heatmaps and recordings, and has an integration with Google Analytics built in. They also have a browser extension, giving instant heatmaps you can see while reviewing your site, and the ability to watch recent recordings for the page you are currently reviewing. Makes it even faster to understand and review interactions on your website. Let’s take a look!
To get started, you obviously need to have already added Microsoft Clarity tracking code to your website. So, if you haven’t already done so, be sure to set up an account and get that added using this article. Next you need to get the extension on your browser. There are two options, one for Edge (which is what I use), and one for Google Chrome. Choose the link below that works for you and get it added!
Hopefully you’ve added an extension before, but if not, it’s really simple. Just click the button to add it to your browser.

You’ll then get a pop up to confirm you wish to add it.

After that, you should notice the little blue triangle icon for Microsoft Clarity, so click on it and get signed into your account.

You’ll then see the About tab by default, giving you information about the features you will have access to from the extension. Click on the Live view tab from the bottom.

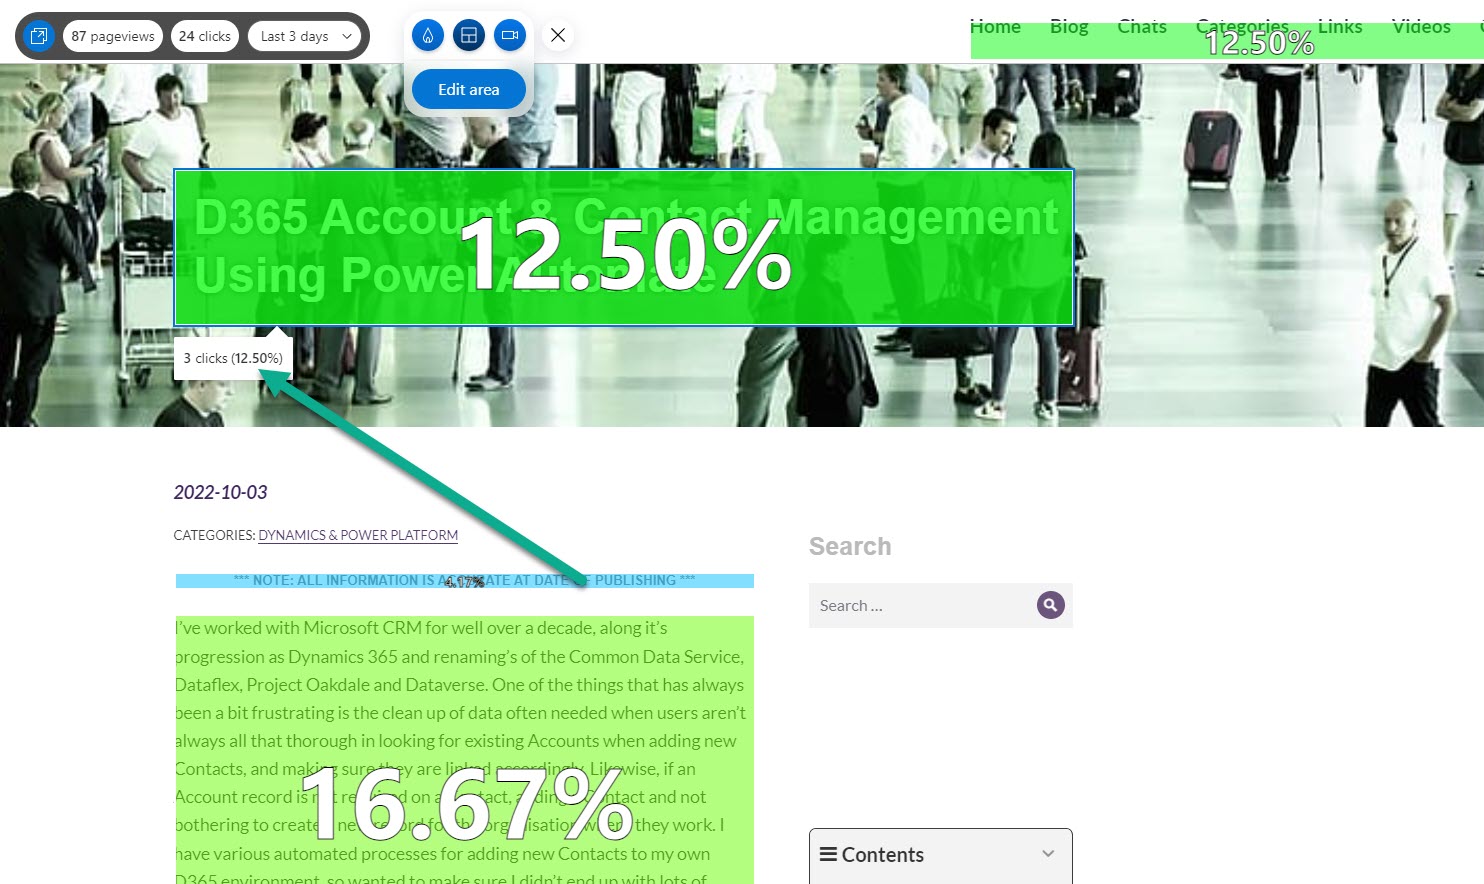
You’ve got links to access your recordings and heatmaps from here, which will take you directly in to Clarity, but we want to turn on the button to Show Clarity widget. You’ll see the widget displayed at the top right of your browser. Make sure you navigate to your website that has Clarity tracking code already installed, then click on the fire icon for heatmaps to start.

The Clarity widget can be moved around to make things easier to see, but currently that doesn’t seem to be sticky, so it will always revert back to the top right when you change pages. After clicking the heatmap icon, a control will be displayed showing the number of pageviews and clicks for a given time frame. This is giving you a heatmap overlay of where the clicks have occurred by visitors to your website. As you scroll down the page, you will also see the percentage of users who reached that point on your page within the selected time frame (last 1 day, 3 days, 7 days and 30 days).

Clicking on the blue icon next to the number of pageviews will take you directly to that heatmap within Clarity including all of the required filters (based on your selection on the widget) so you can view in more detail.

The second icon in the widget is for reviewing an area map. Hovering over a section shows you how many clicks occurred on that element, while the percentage shows the overall click distribution rate for that section.
You can also dig further into an element to get more detail. For example, here we can see that the navigation bar has 23.08% of all the clicks on the page. It might be valuable to know which of the links had the most clicks. Click on the Edit area button from the Clarity widget.

After putting in Edit mode, click on the smaller elements within a large element. So, in this example, the full navigation bar is an element, and each individual link is a smaller element within it. This immediately gives more information about which of the links are clicked on the most within a specific timeframe rather than just knowing nearly 30% click on the navigation.

The last button on the Clarity widget is for recordings. Clicking on this opens an overlay on the right of the screen with a list of all recordings for the specific page being viewed. The full page is selected by default, but you can click on Select area from the top left of the panel and pick a specific area to then filter recordings that include that specifically. This might be valuable if you have something further down the page and want to see how users interact with it to see if they are having issues or getting any errors.

I’ve used Microsoft Clarity for some time now, and I’m impressed with the new features and functionality they keep rolling out. Even more impressed that it’s free.
Check out the latest post:
Use Custom Event Registration Questions To Branch Your Journeys In Customer Insights
This is just 1 of 603 articles. You can browse through all of them by going to the main blog page, or navigate through different categories to find more content you are interested in.