
A contact can open every email you send and still have no intention of buying, while someone who barely engages with your marketing could be exactly the qualified lead your sales team wants to speak to, which is why a useful lead score needs to look beyond activity alone. In HubSpot, lead scoring helps you bring together what you know about a contact and how they interact with your business, giving your team a clearer way to prioritise conversations, provided you’ve thought carefully about which signals actually matter. In this post we will look at how it all works with clear examples and step by step for understanding and creating your own lead scoring.
Understanding HubSpot Lead Scoring Options
First, make sure you are on the right subscription, either Professional or Enterprise. Then understand if you have the Marketing Hub and/or Sales Hub as this determines how many you can create and which records you can score. Marketing Hub allows you to score Contacts and Companies (up to 5 with Professional, up to 50 with Enterprise) while Sales Hub allows you to score Companies and Deals (up to 5 with Professional, up to 10 with Enterprise).
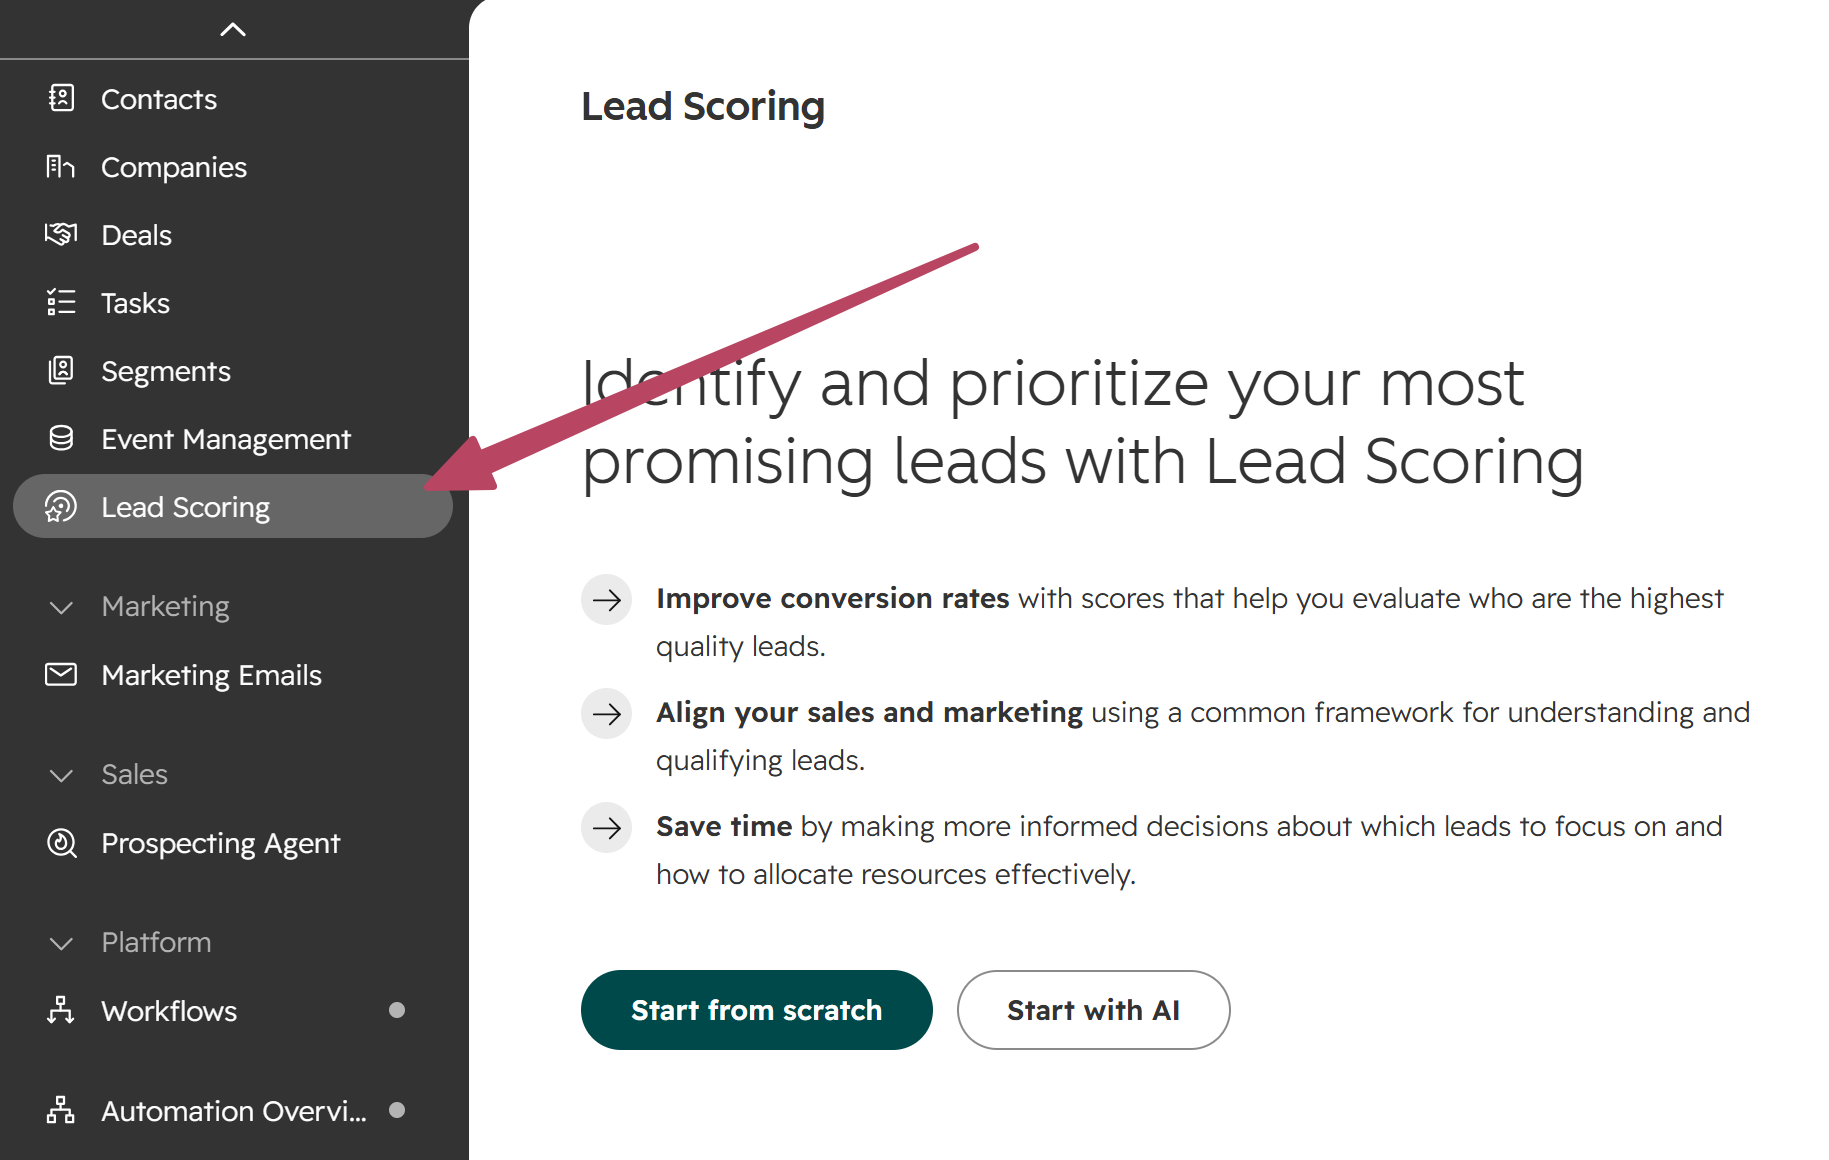
Assuming you have access, find Lead Scoring in the menu navigation to begin. Using the start with AI option is only an option if you have Marketing Hub Enterprise and a minimum sample size of 50 contacts, containing 25 converted and 25 non-converted, is required to generate a score.
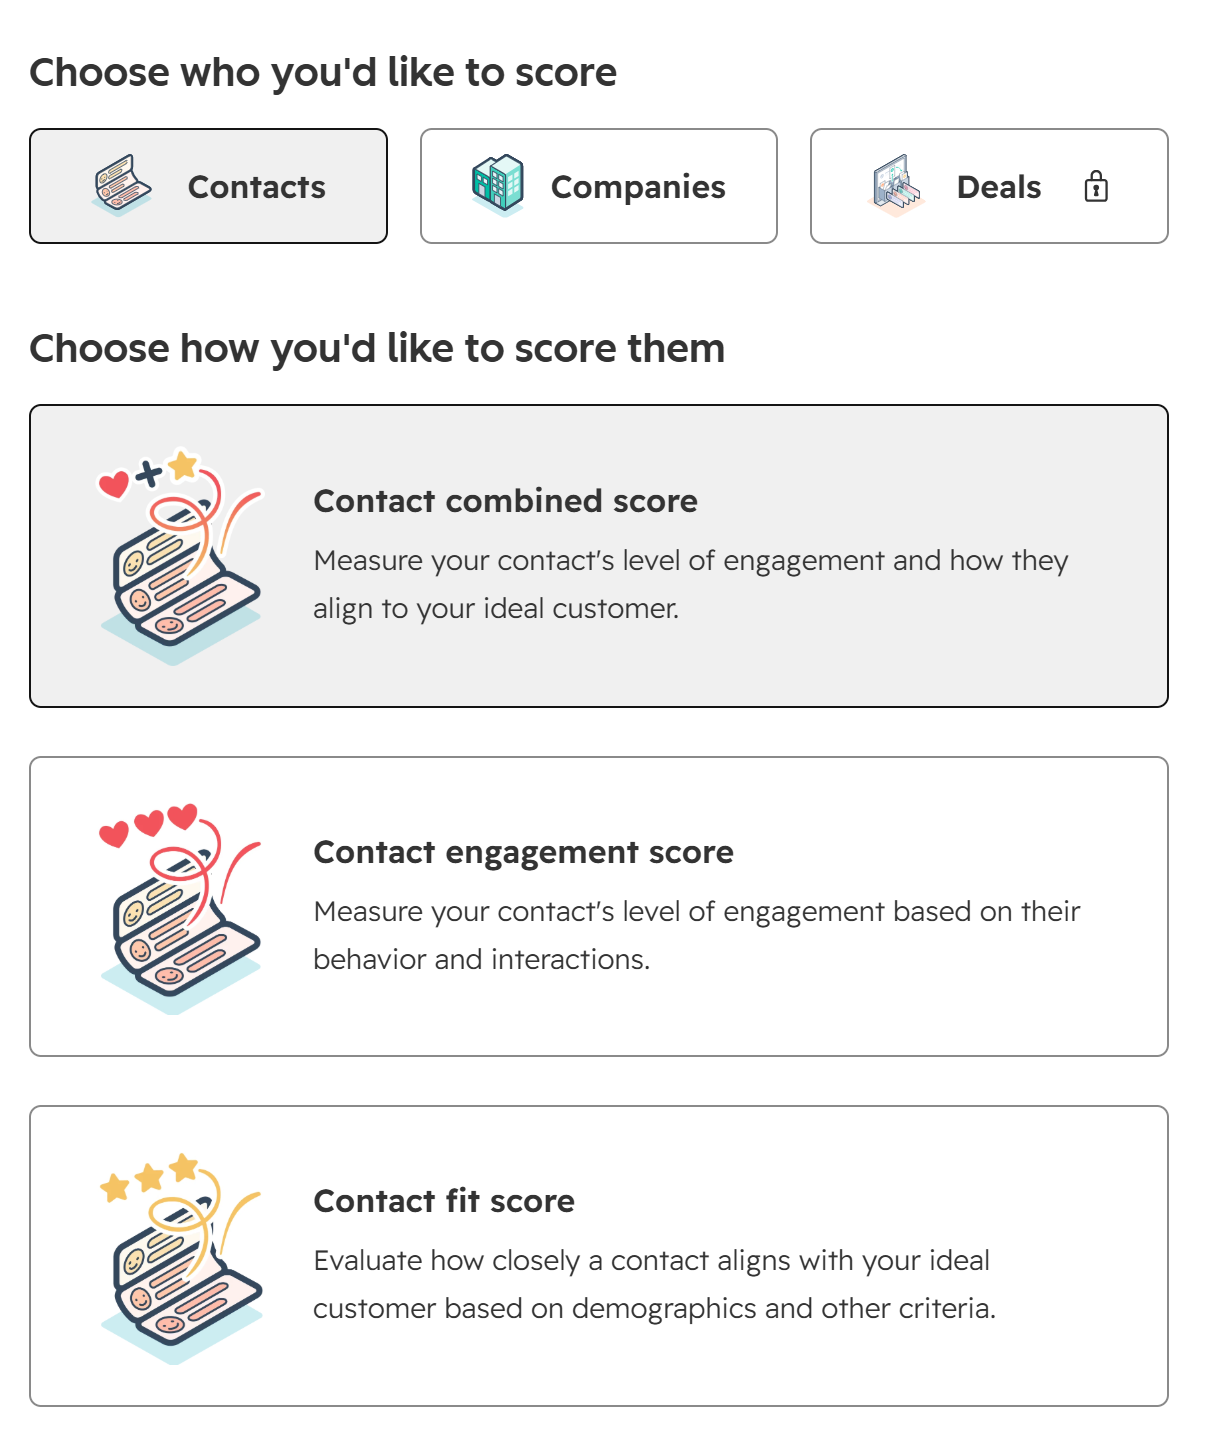
In this example we will look at scoring Contacts, but you can select from Companies and Deals depending on your subscription. For Contacts we can look at a combined score, or score based on engagement alone, or properties alone to get a Contact fit score.
Creating Your Lead Scoring Model
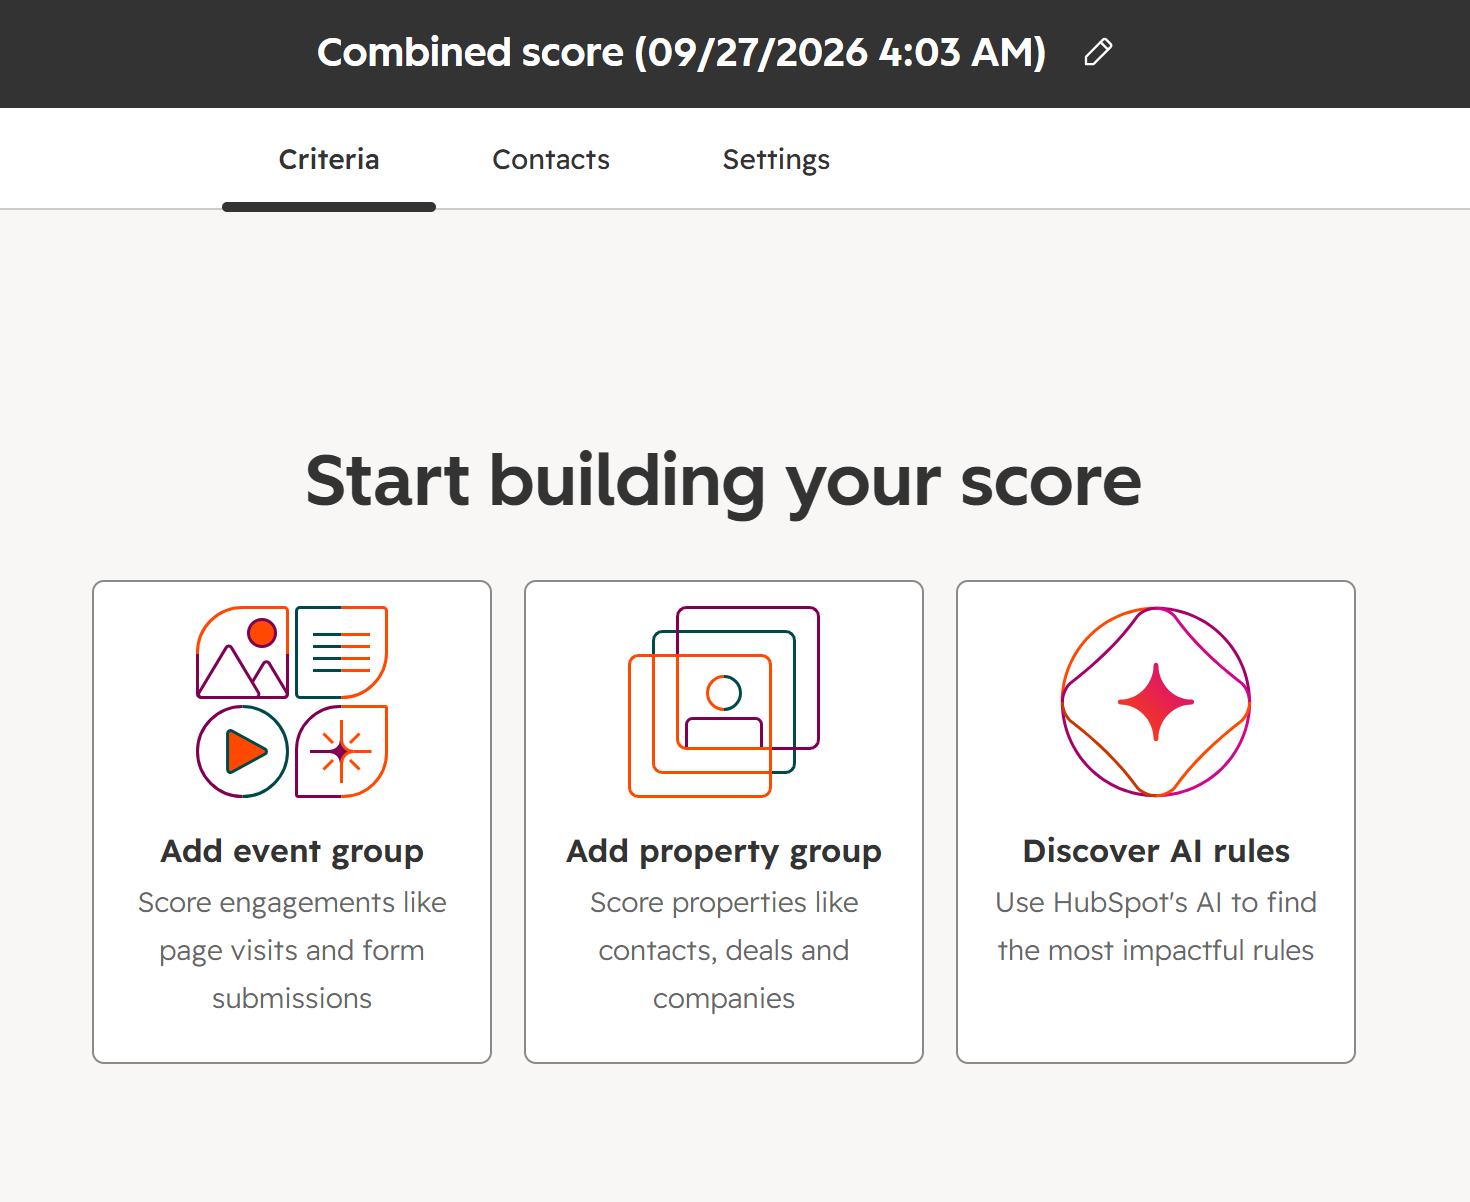
Next we can start adding criteria to the scoring model. You can also change the name of your Lead scoring from the top of the screen. Click add event group to get started.
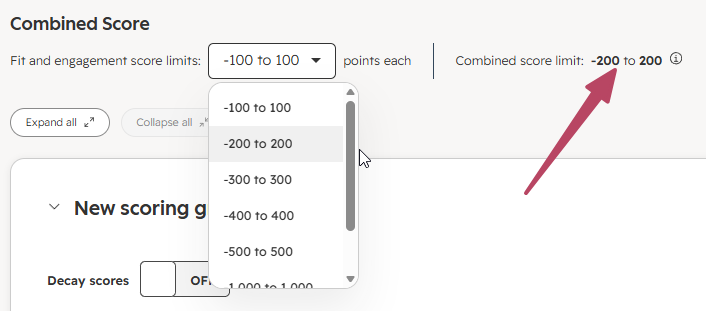
One thing to be aware of, and that is setting the score limits. With every client I have worked with, there has always been the back and forth of what should the score add up to. Should it be 100? 500? 1,000? That really depends and ties in with the number of points you think you should then allocate to each ‘thing’ that is done and criteria that is met. In reality, it doesn’t matter that much as long as you are consistent and don’t allocate say 50 points to each little thing that happens or you will end up with Leads getting the max score possible way to quickly. Note that for a Combined Score model, the score limit will be doubled (includes the score for Fit and Engagement in one).
Adding Engagement Criteria and Assigning Points
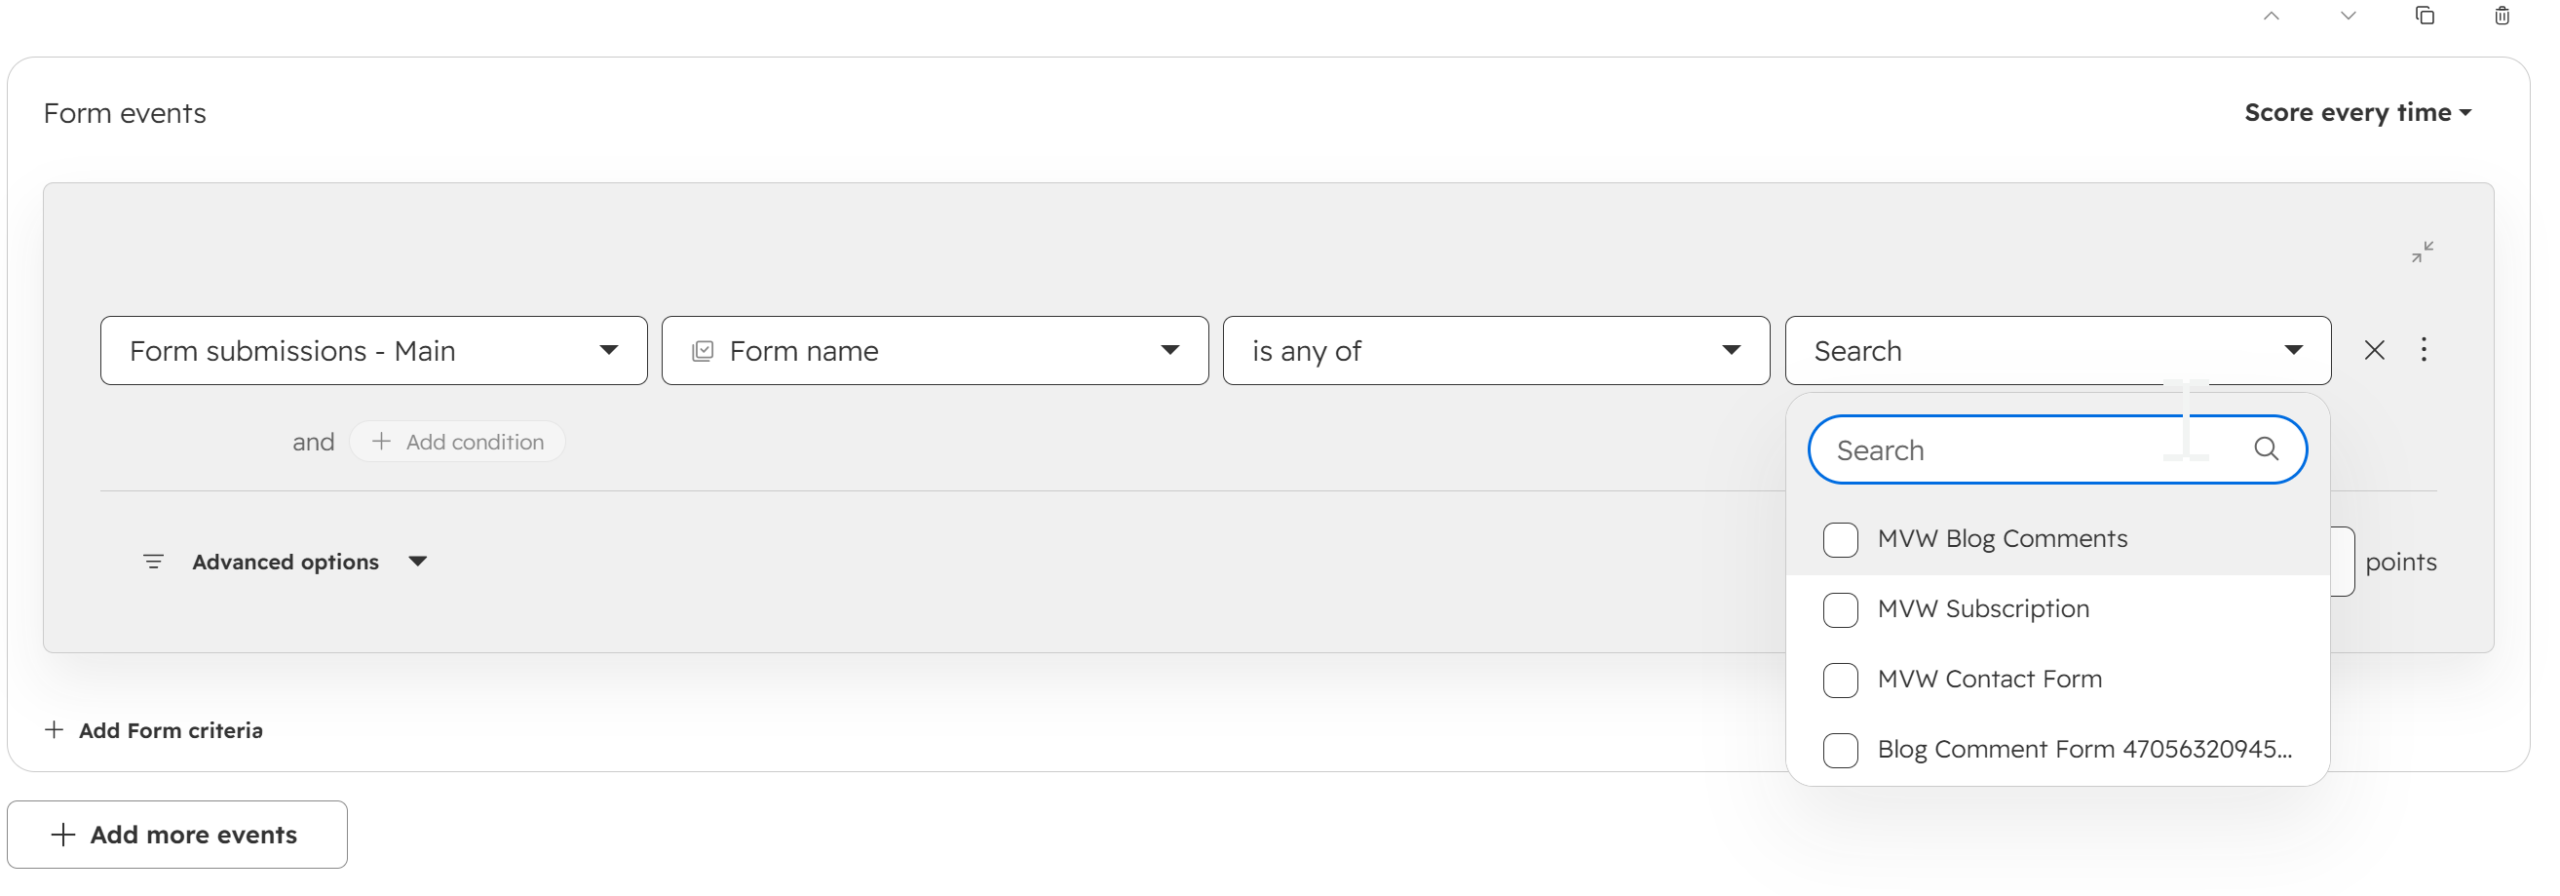
This is where we can start looking at the events generated in HubSpot and indicate which ‘things’ are important to us. For example, we can add Form events and allocate points to score when someone submits forms. In the example below, rather than all forms, we can pick a specific form from the list.
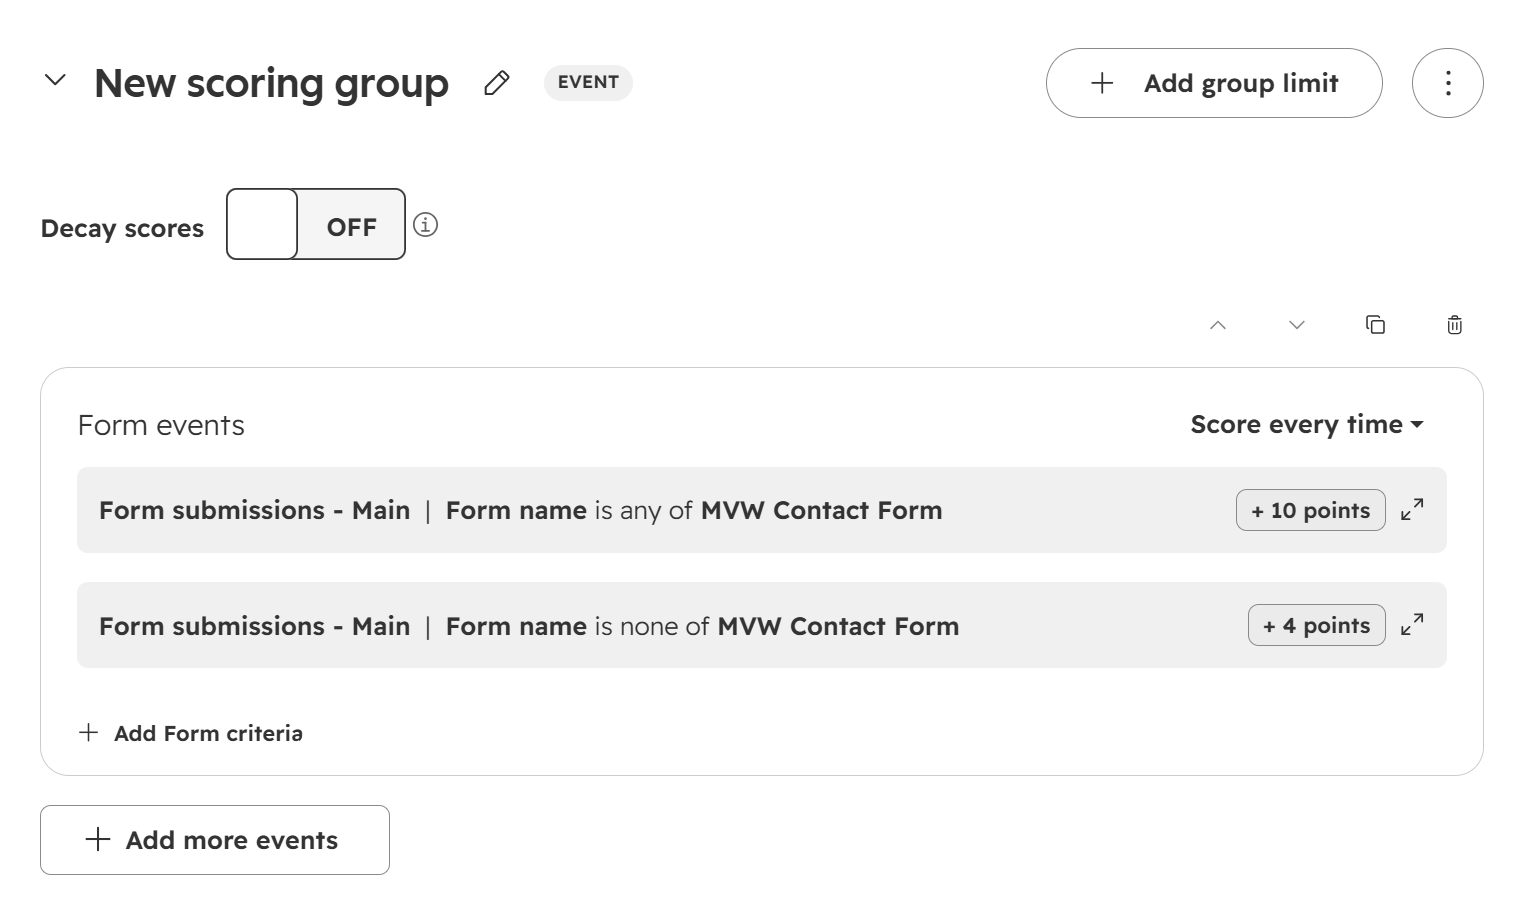
We can add additional form criteria to indicate that if the form submitted is the Contact Form, we give 10 points, and for all others that are NOT the Contact Form, we can give 4 points. This helps weight the interaction based on a greater need or indication of interest.
Using Score Decay, Frequency and Group Limits
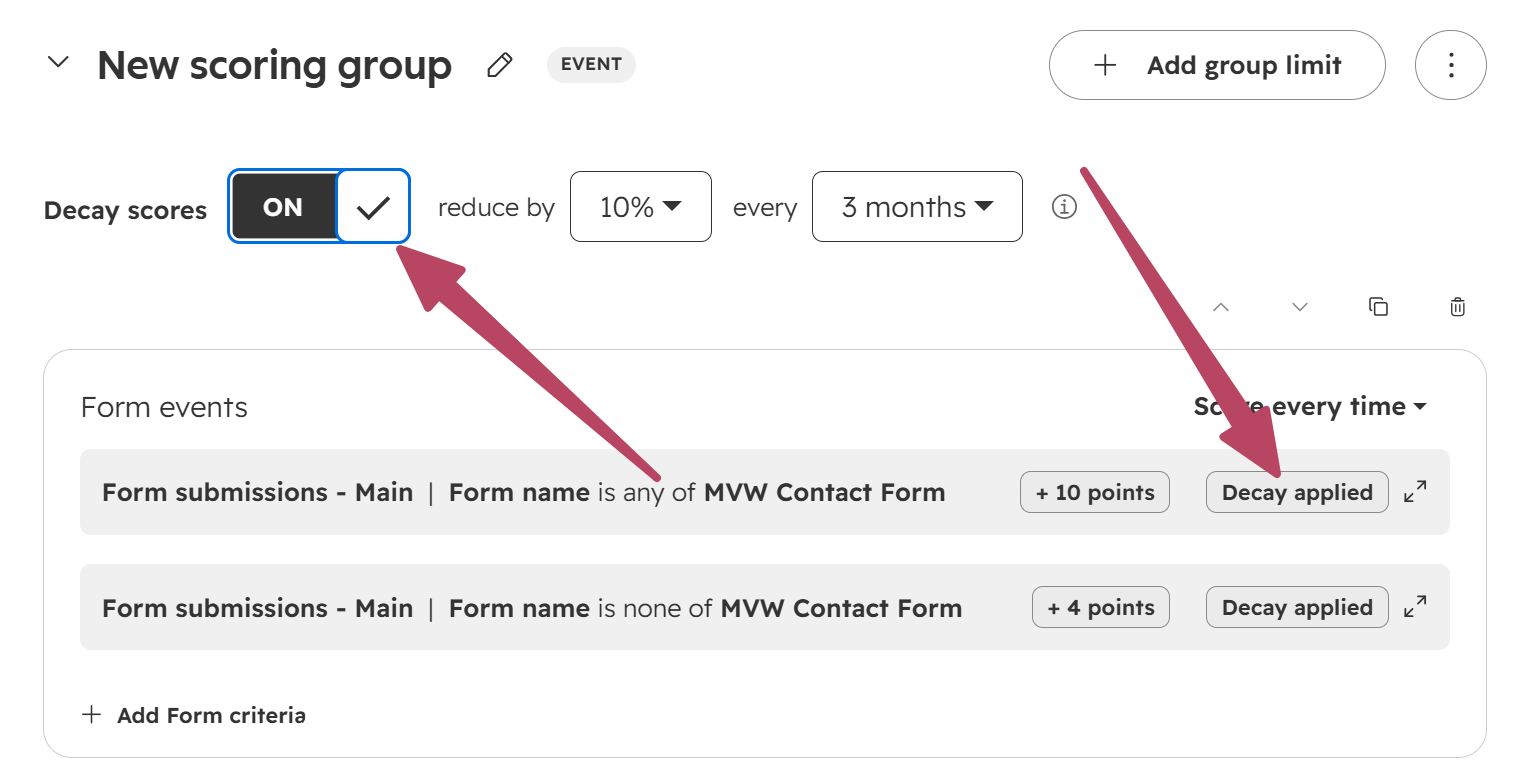
We can also apply a decay of scores to this group. When we do this, it is set on everything in that group so the reduction of 10% based on a 3 month time frame would be applied. This could be useful so we are not allowing high scores to build up even if a Contact filled out the Contact form a few times 6 months ago but did nothing else since.
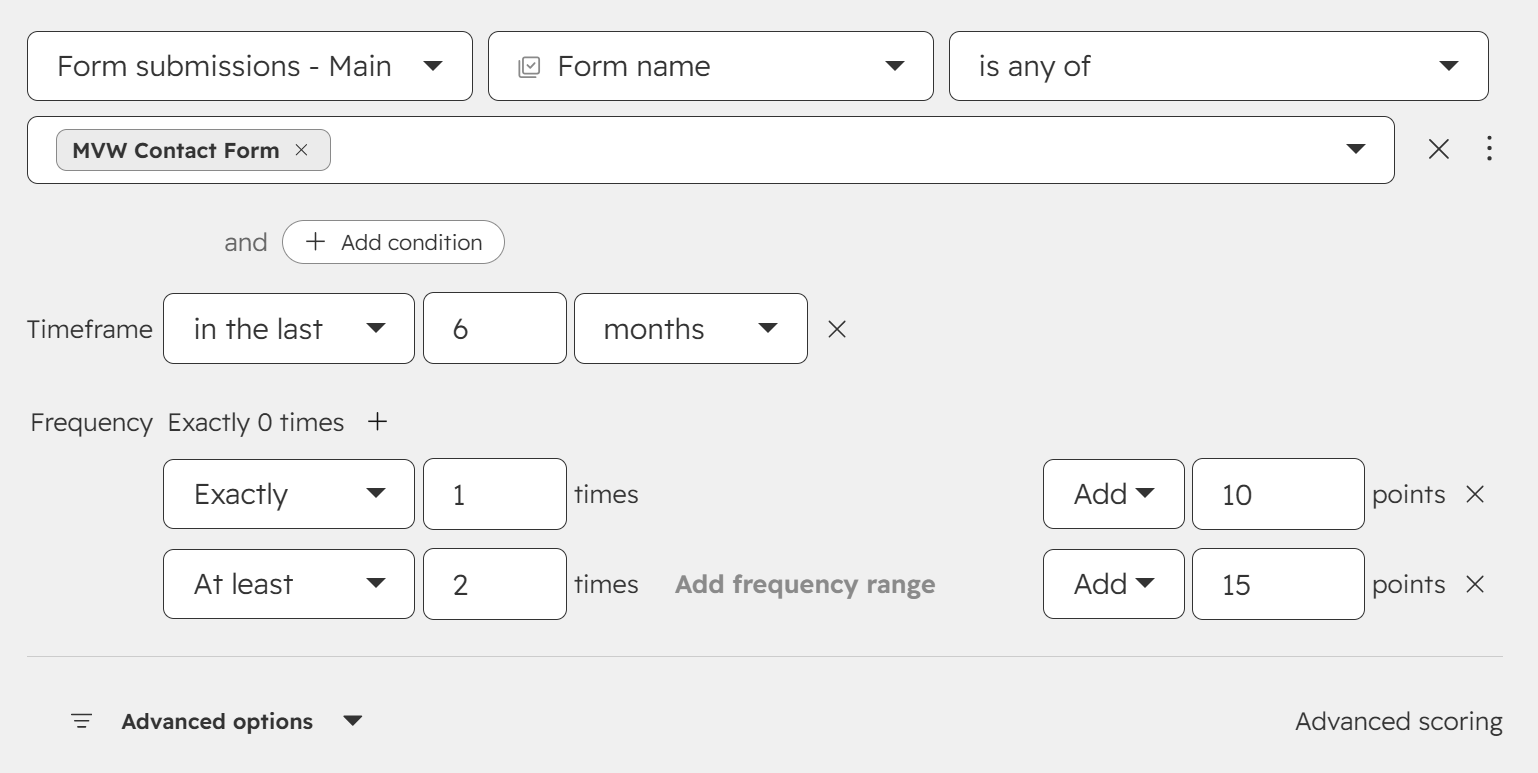
Instead of applying decay scores, we can add different groups for the forms (in this example) then add a timeframe and frequency using the Advanced options. So in the example below, we are looking for form submissions in the last X months. Then we can determine how many points to allocate if someone fills it out once, vs more than once. This can also be helpful so we don’t allocate too many points for someone who keeps filling out the same form.
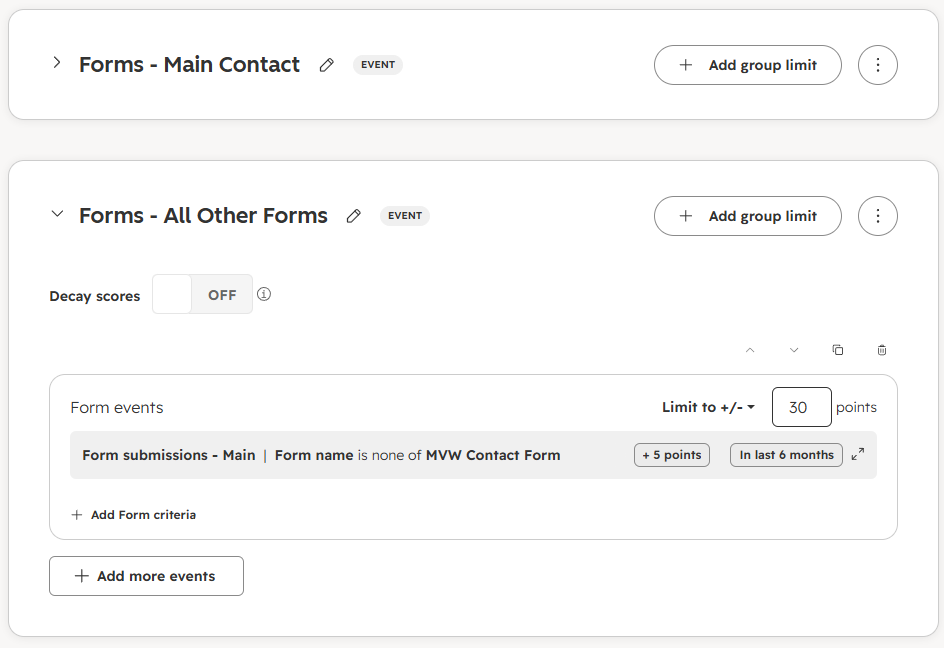
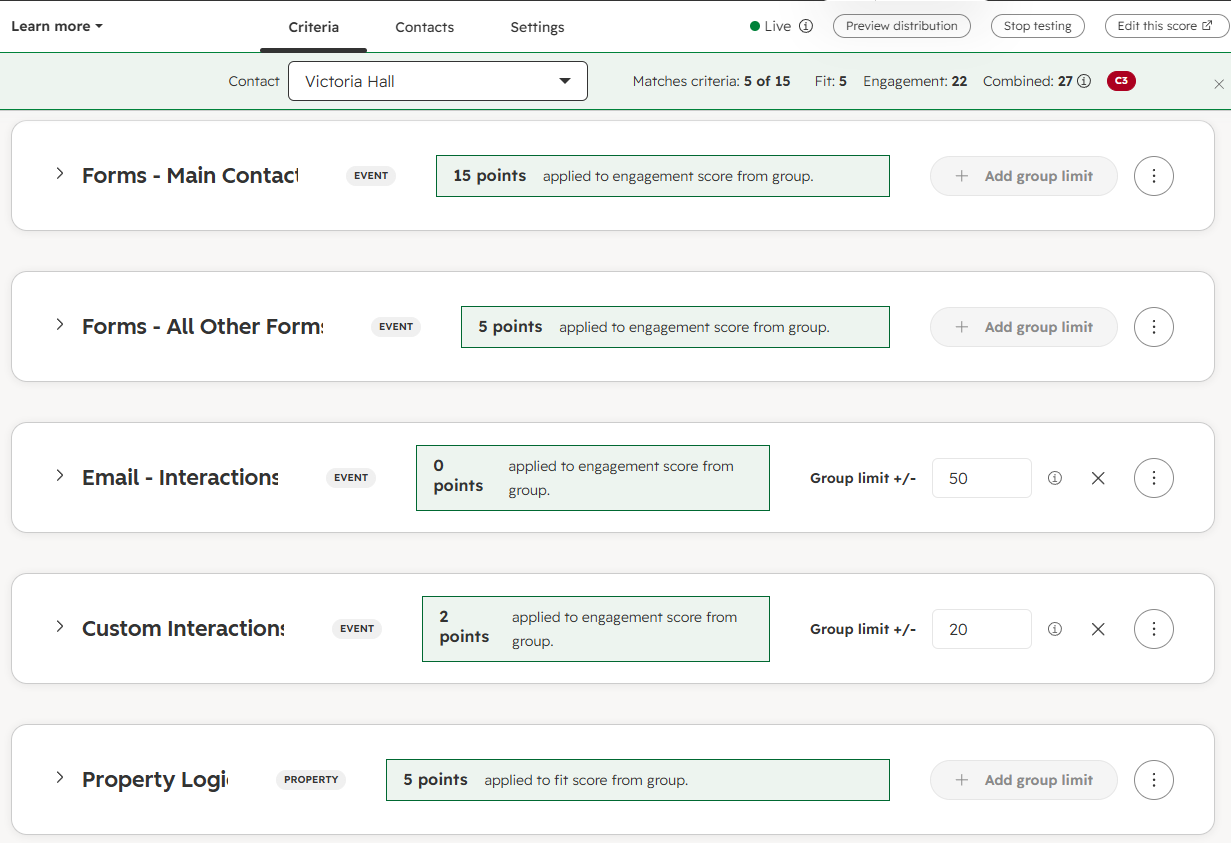
In the example below, we have the first group with all the logic for the Main form, then a group for all other forms. We can assign a group limit, or a limit on the event itself so we can only ever give 30 points for additional form submissions rather than allowing the score to be inflated for every single one.
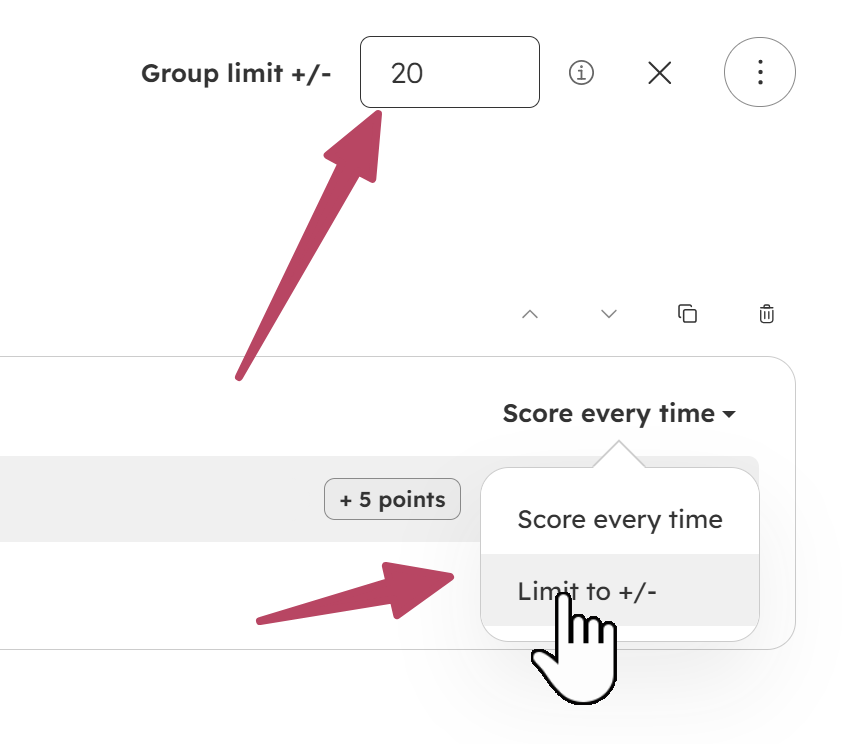
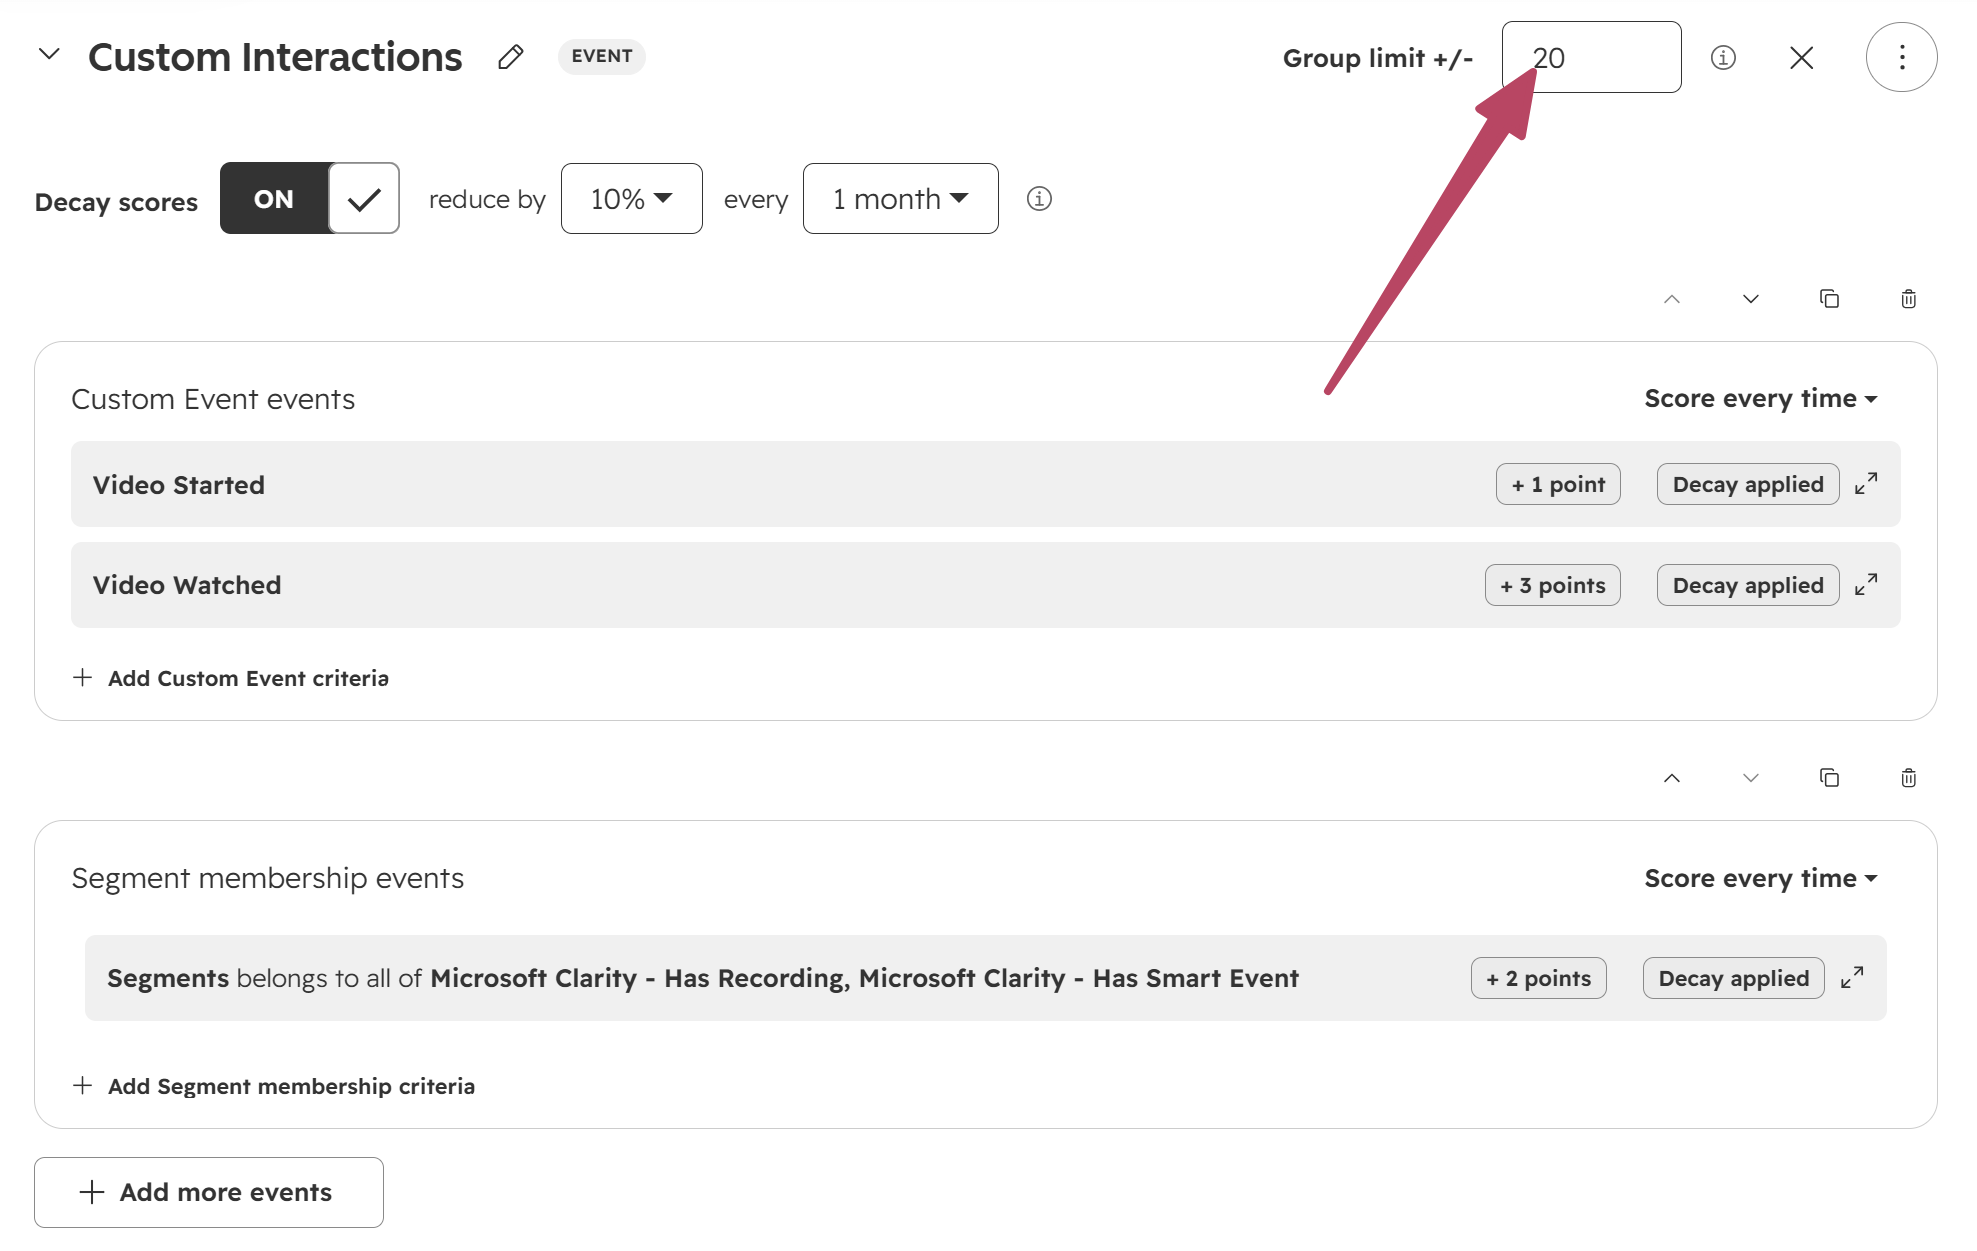
The group limit would apply to everything with in that group, regardless of all the events you add to it and would stop for all events once it hit 20 in the example below.
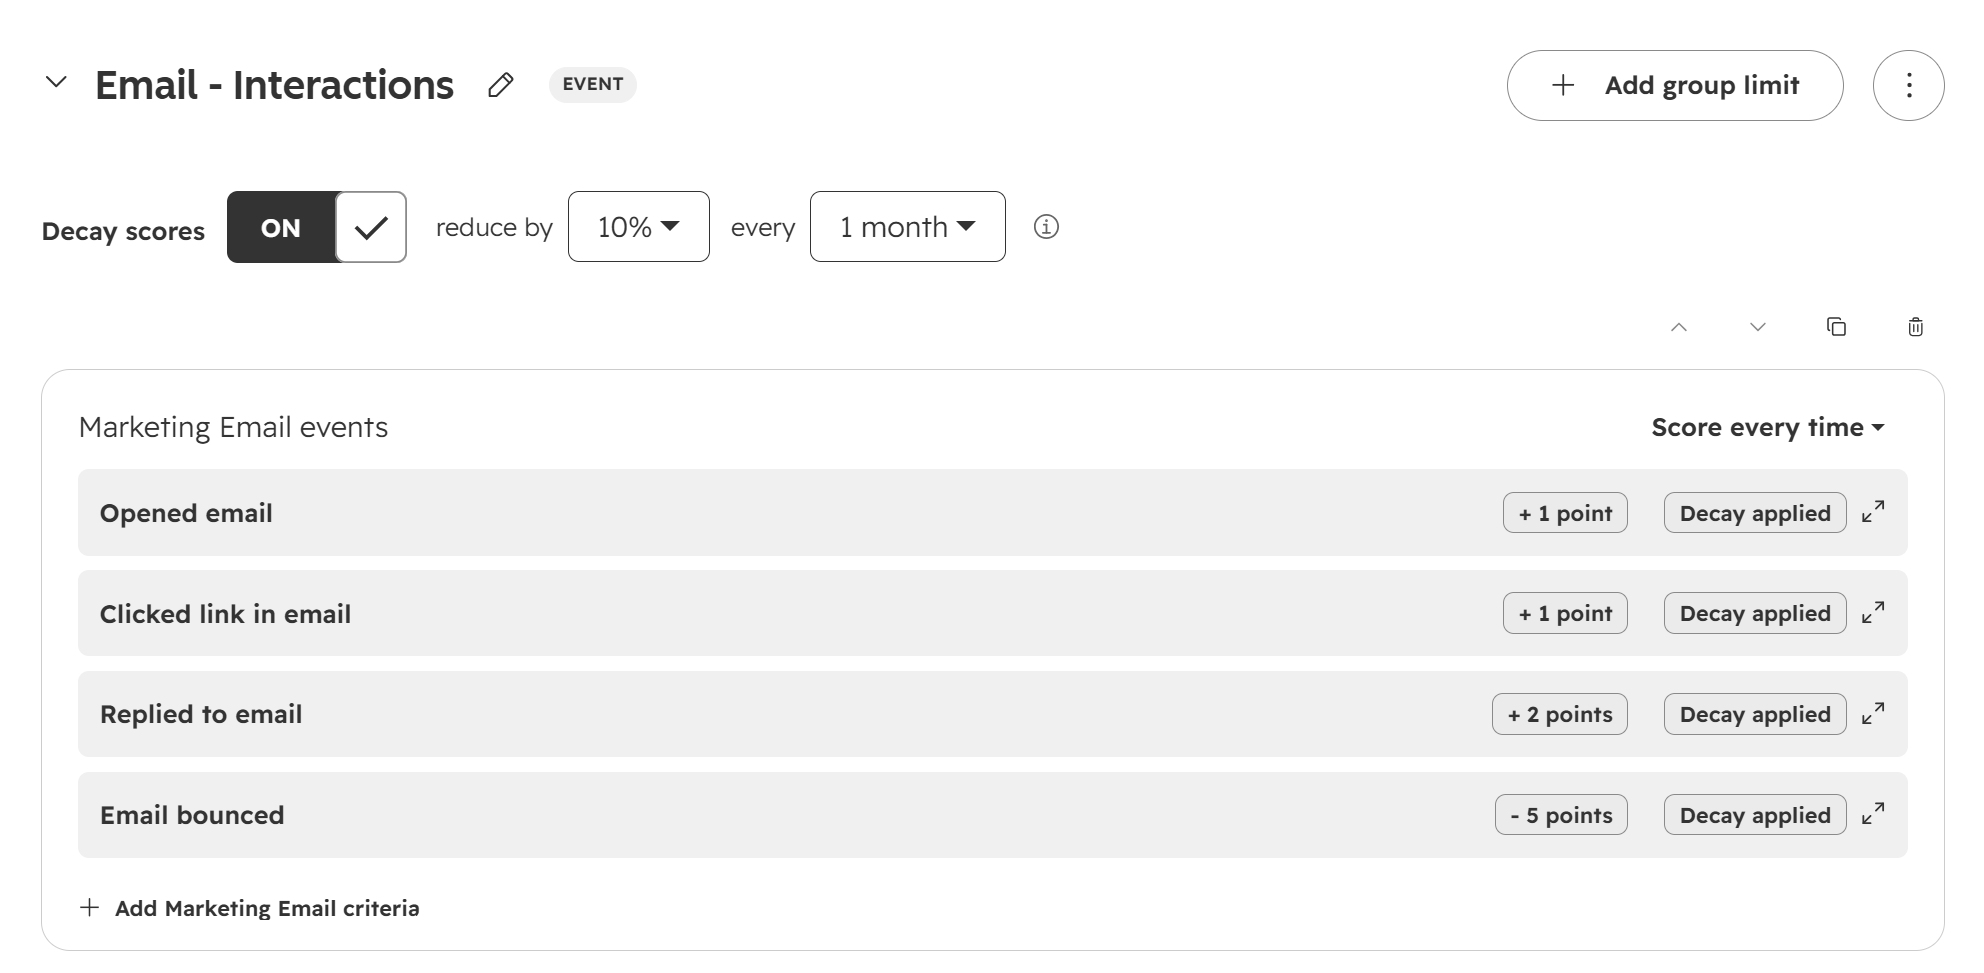
Marketing Email events would be something to add in, definitely an indicator of levels of engagement. Keep in mind that not everything needs to be adding scores. In fact, things like an email bouncing should probably take points away if anything. These make sense to combine in one group to be able to review easily. Notice this group has decay applied so that we start to reducing the scoring each month to keep the score fresh.
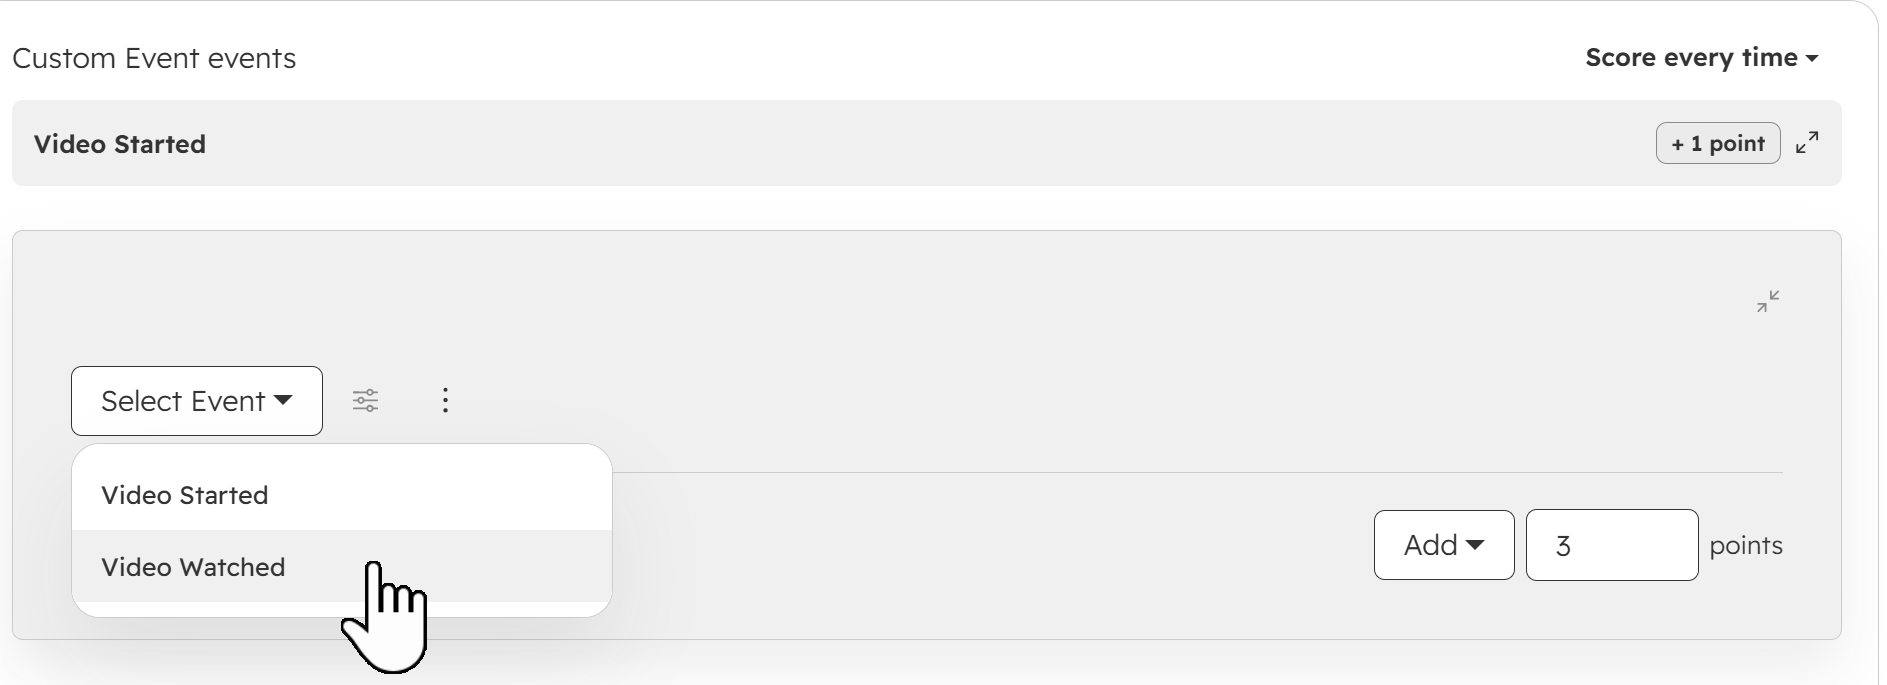
We can also add any custom events you might have in your portal. Here was can see a Contact gets 1 point if they start a video playing on the website, and 3 points if they finish watching the video.
Again, keep in mind that turning decay scores on for a group applies it to everything within that group, so make sure you’ve set up those groups logically.
Adding Contact Fit Criteria Using Properties
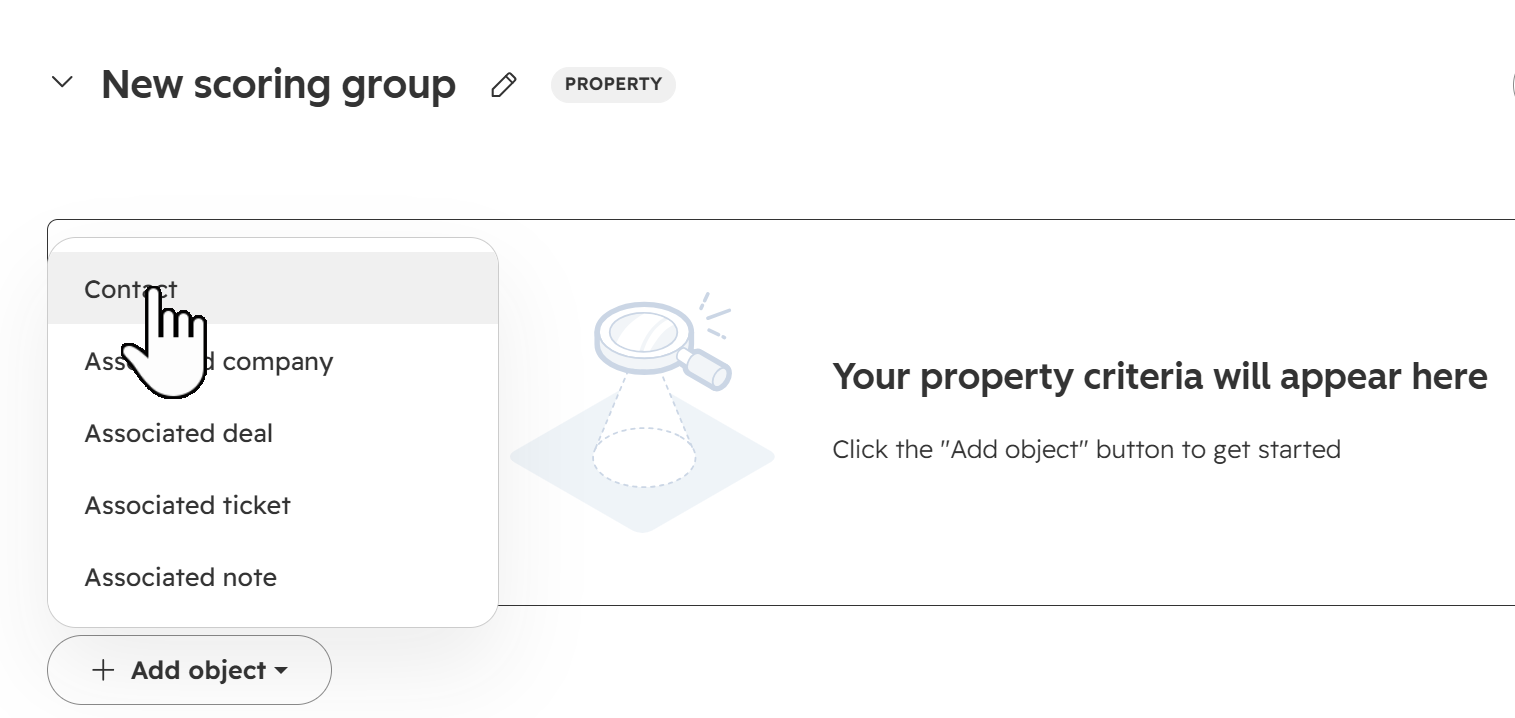
From the bottom of the lead scoring, click to add a new property group. Then determine if you want to use a property from the Contact record directly, or a record the Contact could be associated with.
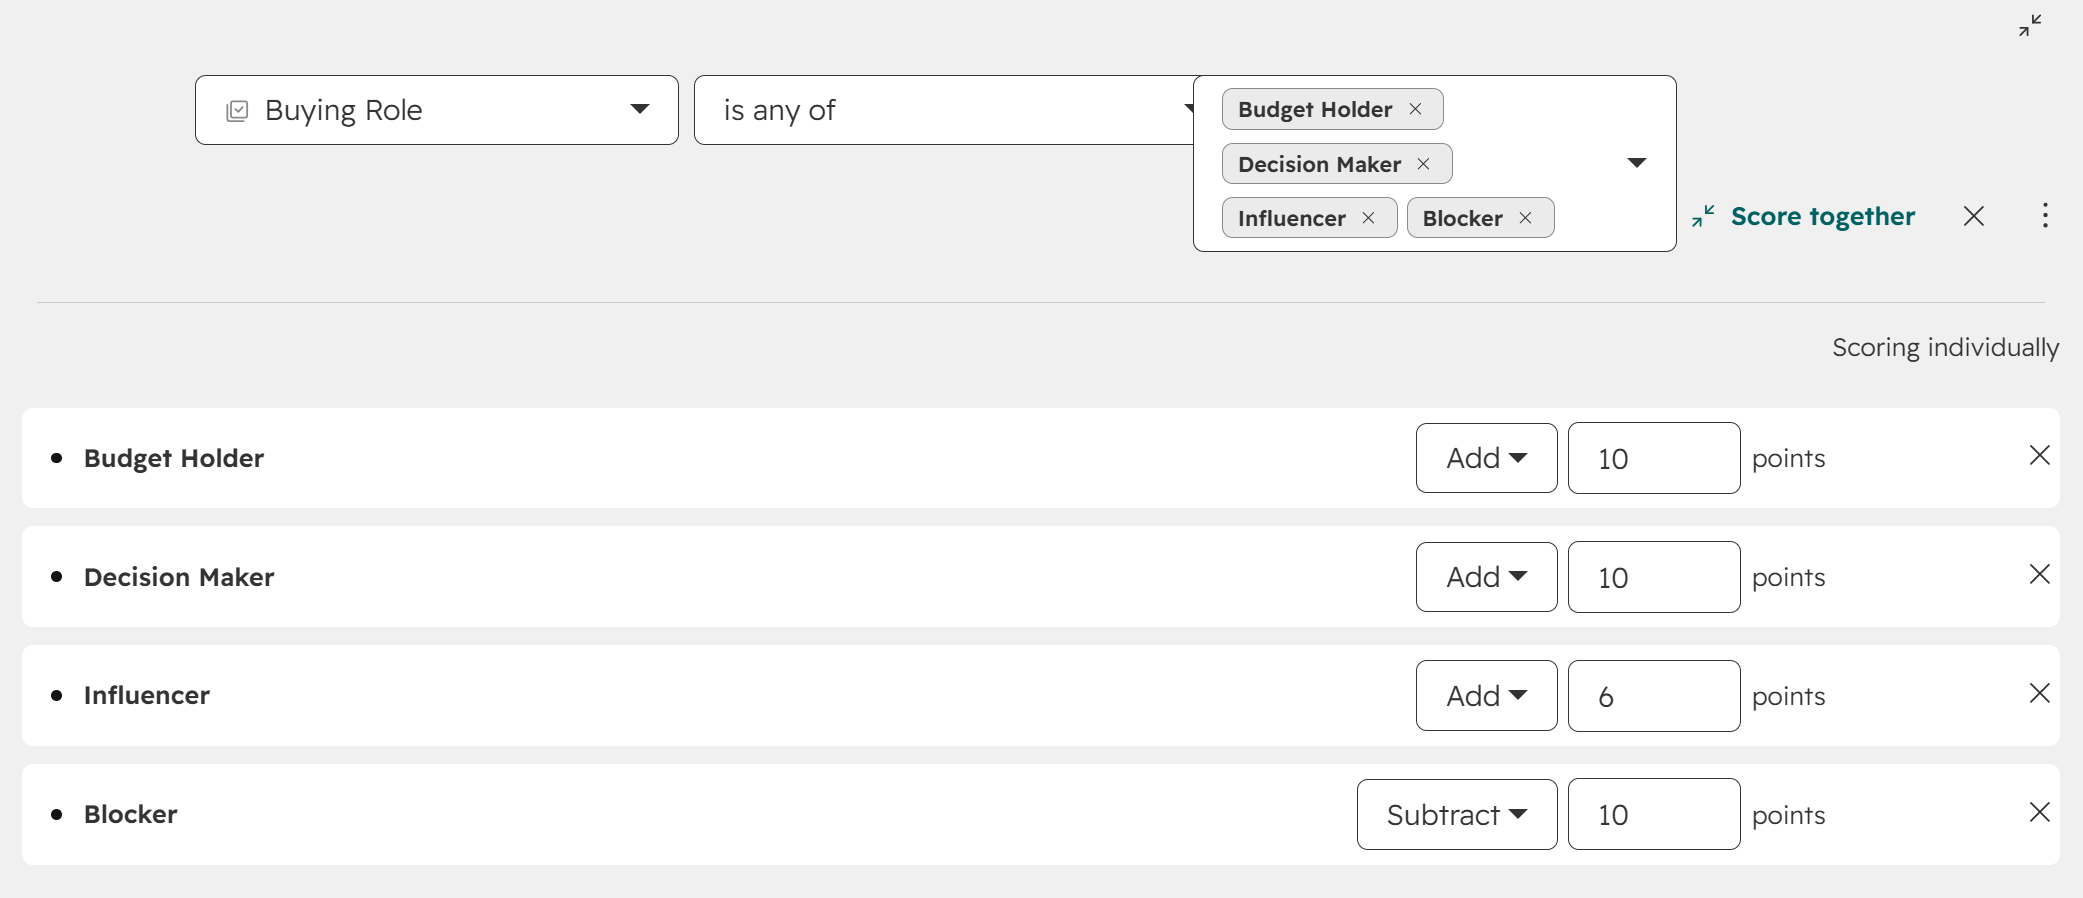
Here is an example of using the Buying Role property and selecting several options, then setting different scores depending on what the value is. We can give high scores for Budget Holder and Decision Maker, points for Influencers, but then subtract points if someone has been identified as a Blocker.
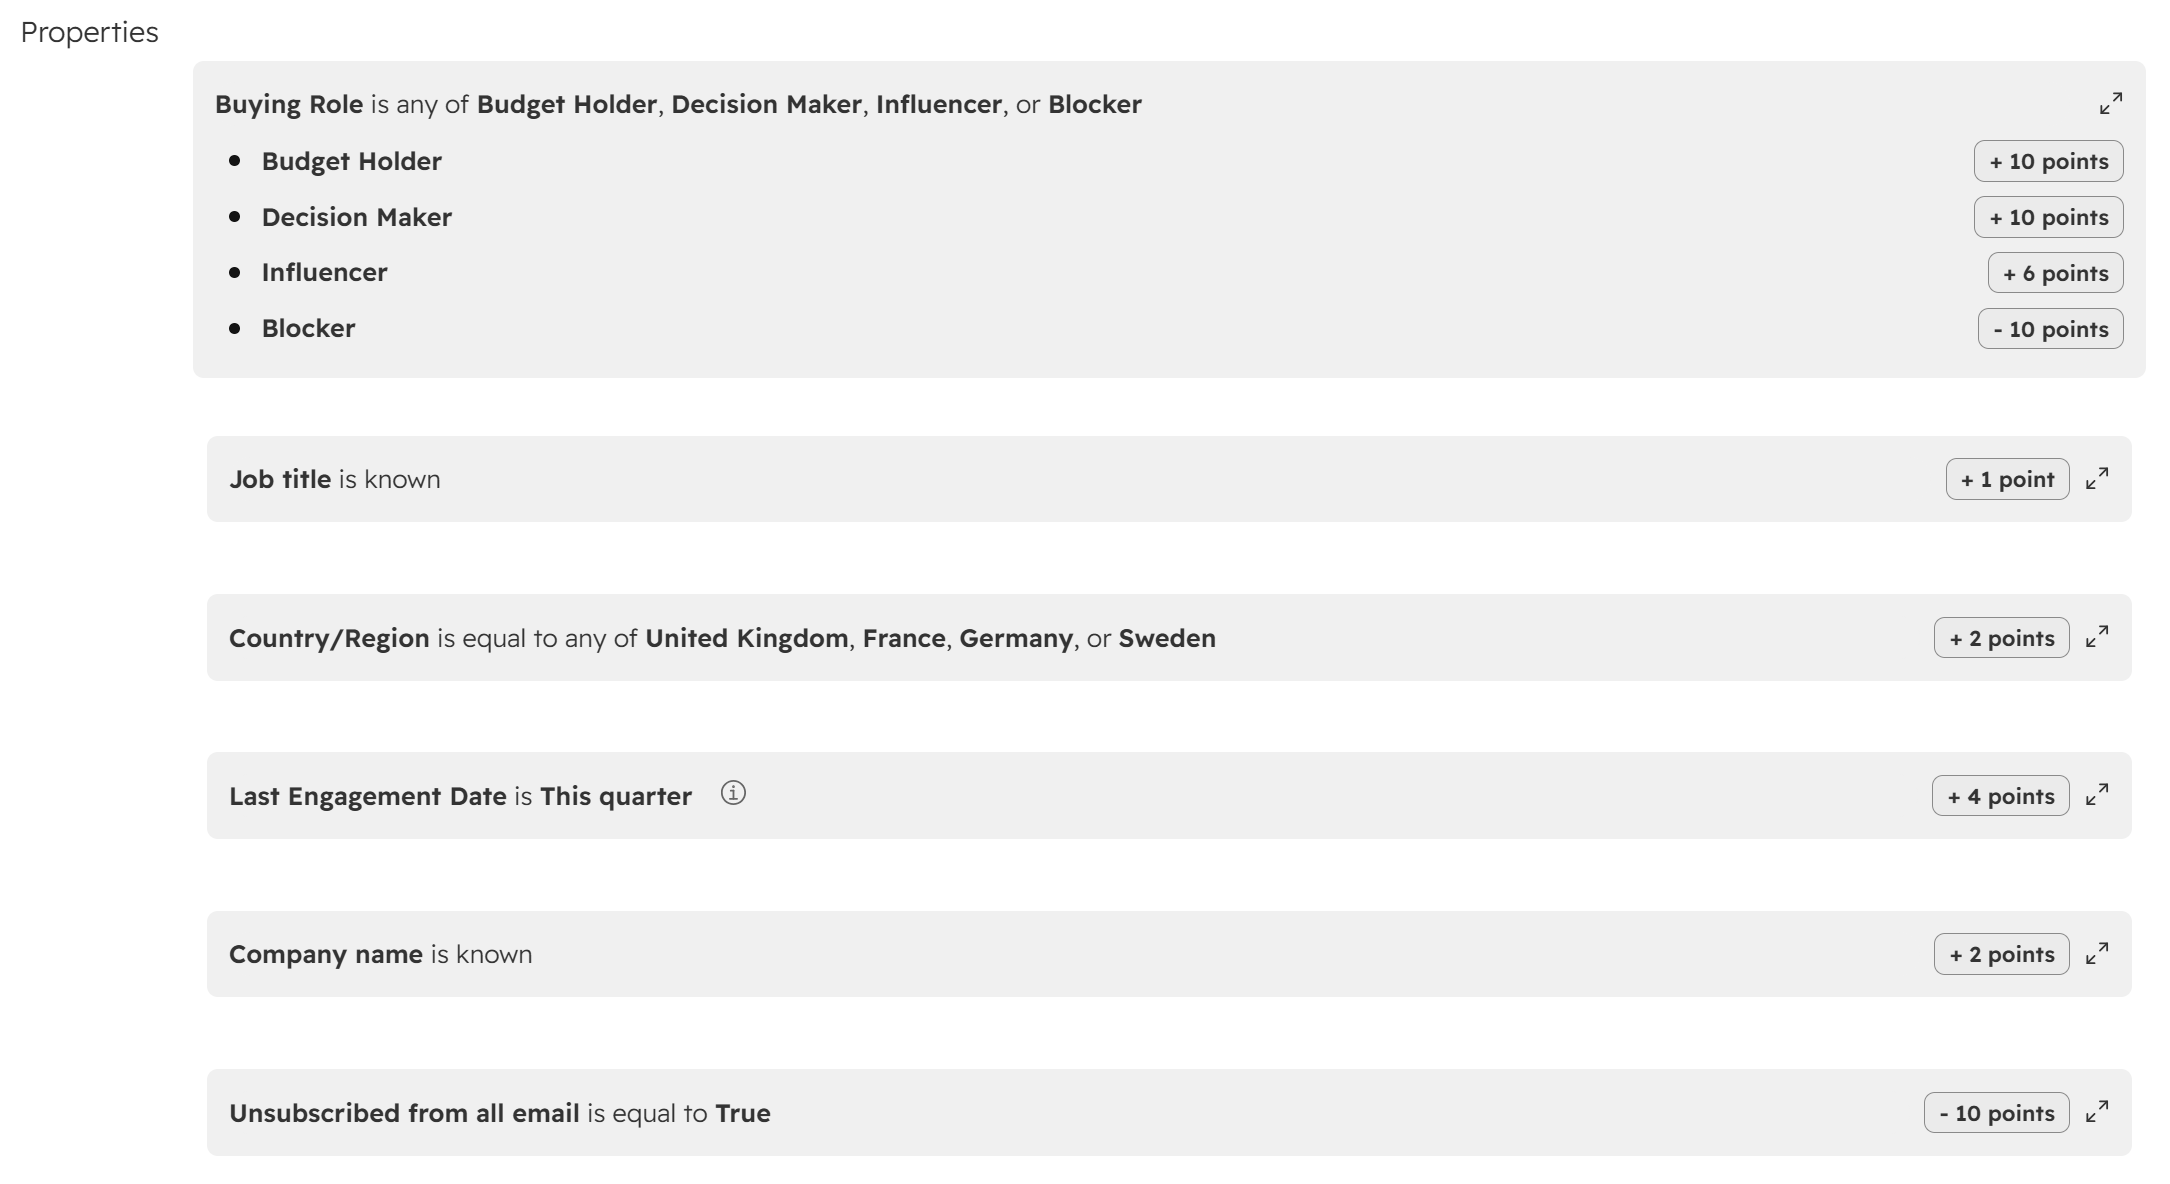
We can continue to add additional properties such as points applied if the Job Title or Company Name are known, if the Last Engagement Date is the quarter, or if their Company is one of several that are important to you for Sales. Finally, we can subtract points if they have unsubscribed from all email.
Choosing Which Contacts to Score and Setting Thresholds
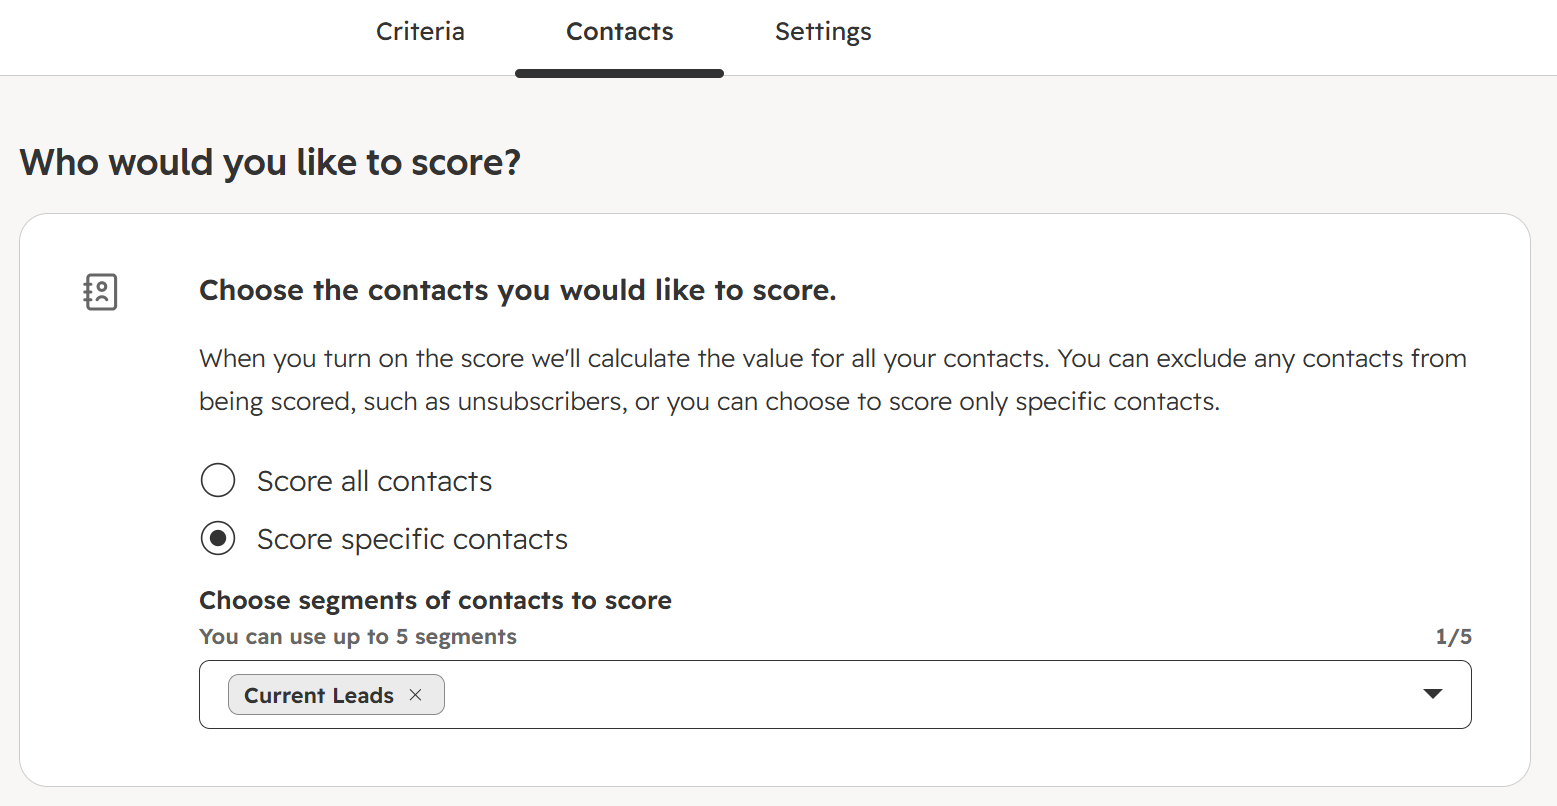
Once you’ve added in all of your criteria, click the Contacts tab at the top. This is where we determine who we are scoring. For my example, I am only going to score Contacts who are in the ‘Current Leads’ segment which is defined by Contacts with specific values on the Lifecycle Stage property.
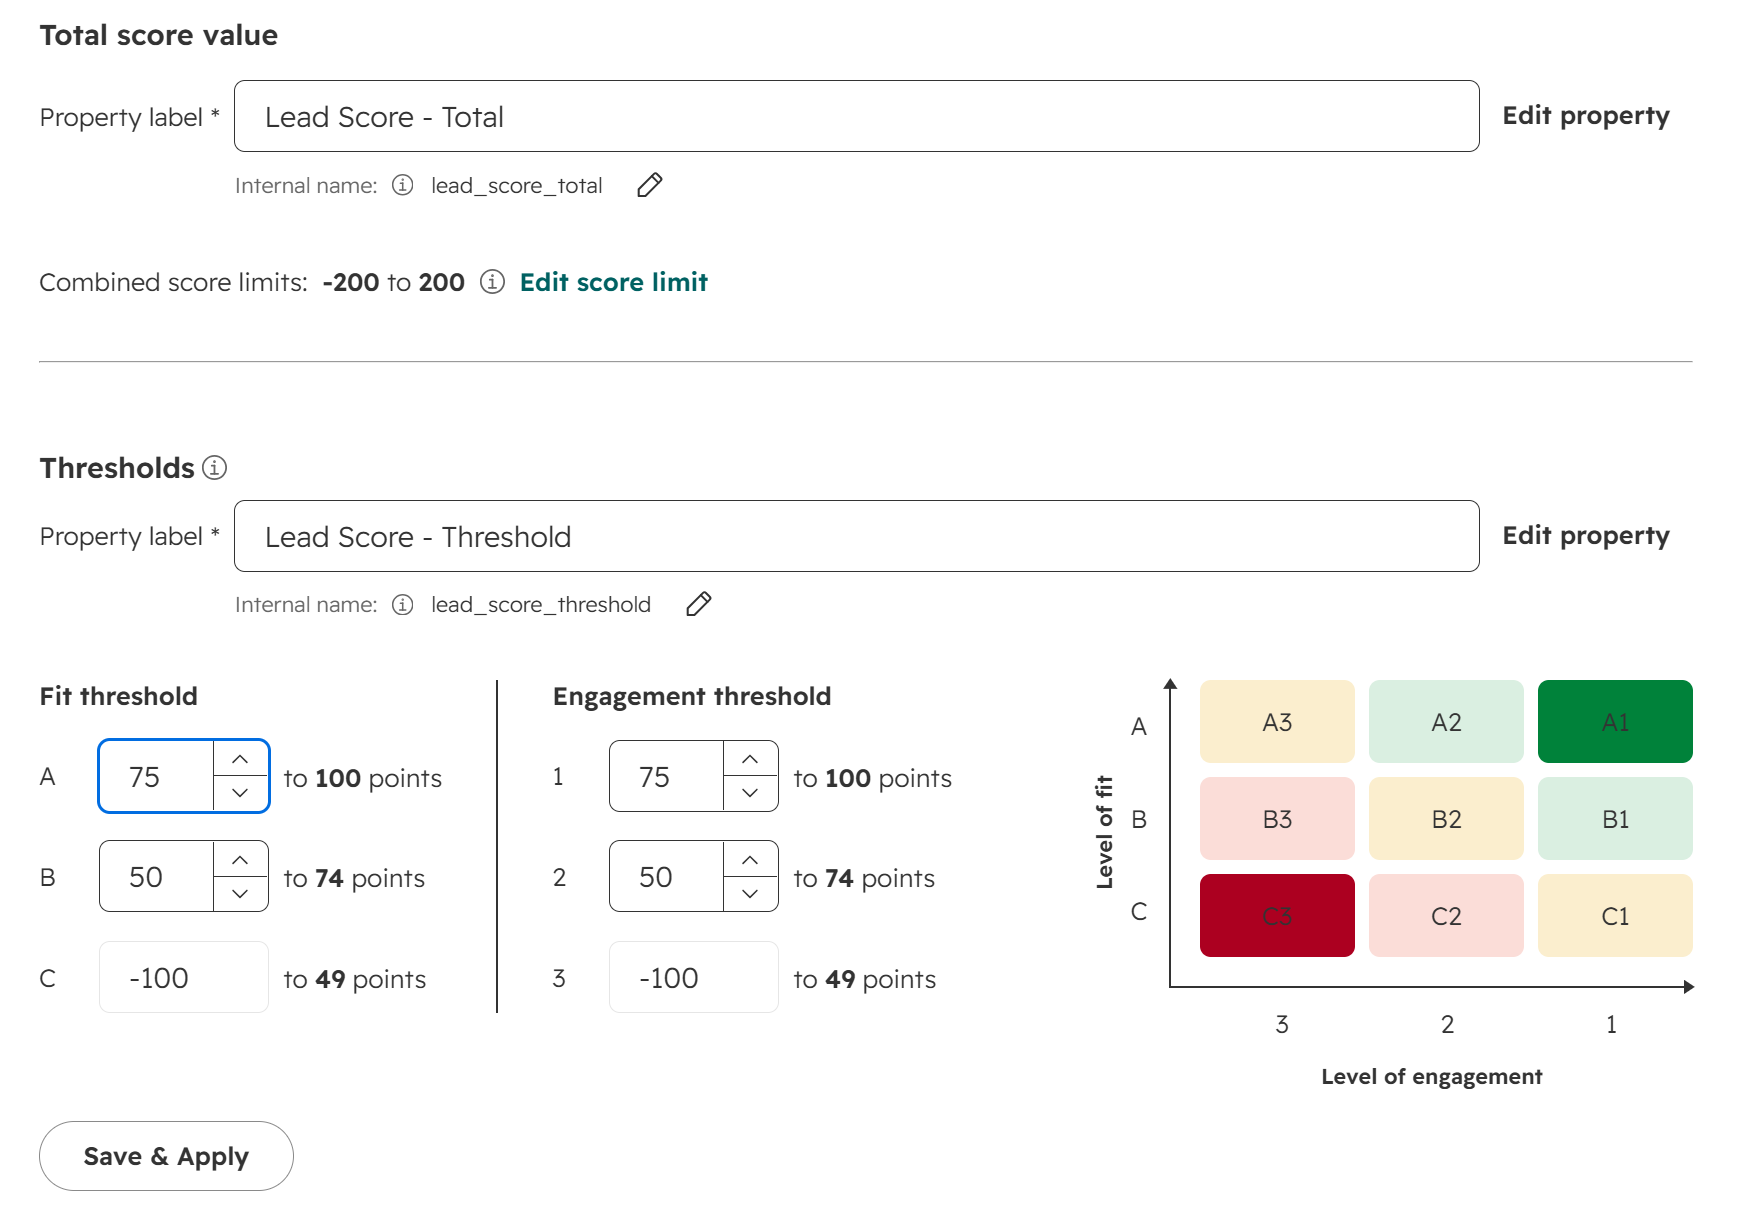
Finally, move on to the Settings tab. From here, take a moment to review all of the different sections which is where it will be determined the property label and internal name for each new property that will be created when you make the Lead Score live. By default, they will have been given a name that includes the name of your Lead Score record first, then either Fit, Engagement, Total or Threshold. Best practice would be to review and rename both the property label and internal name to reduce the length and perhaps make them clearer for your users. You can also look at the thresholds to determine when a Contact should fall in to the different ‘buckets’ for Fit or Engagement. You can always adjust the thresholds at a later date if you find too many or not even Contacts are falling in to the different areas.
Previewing Your Lead Scores Before Going Live
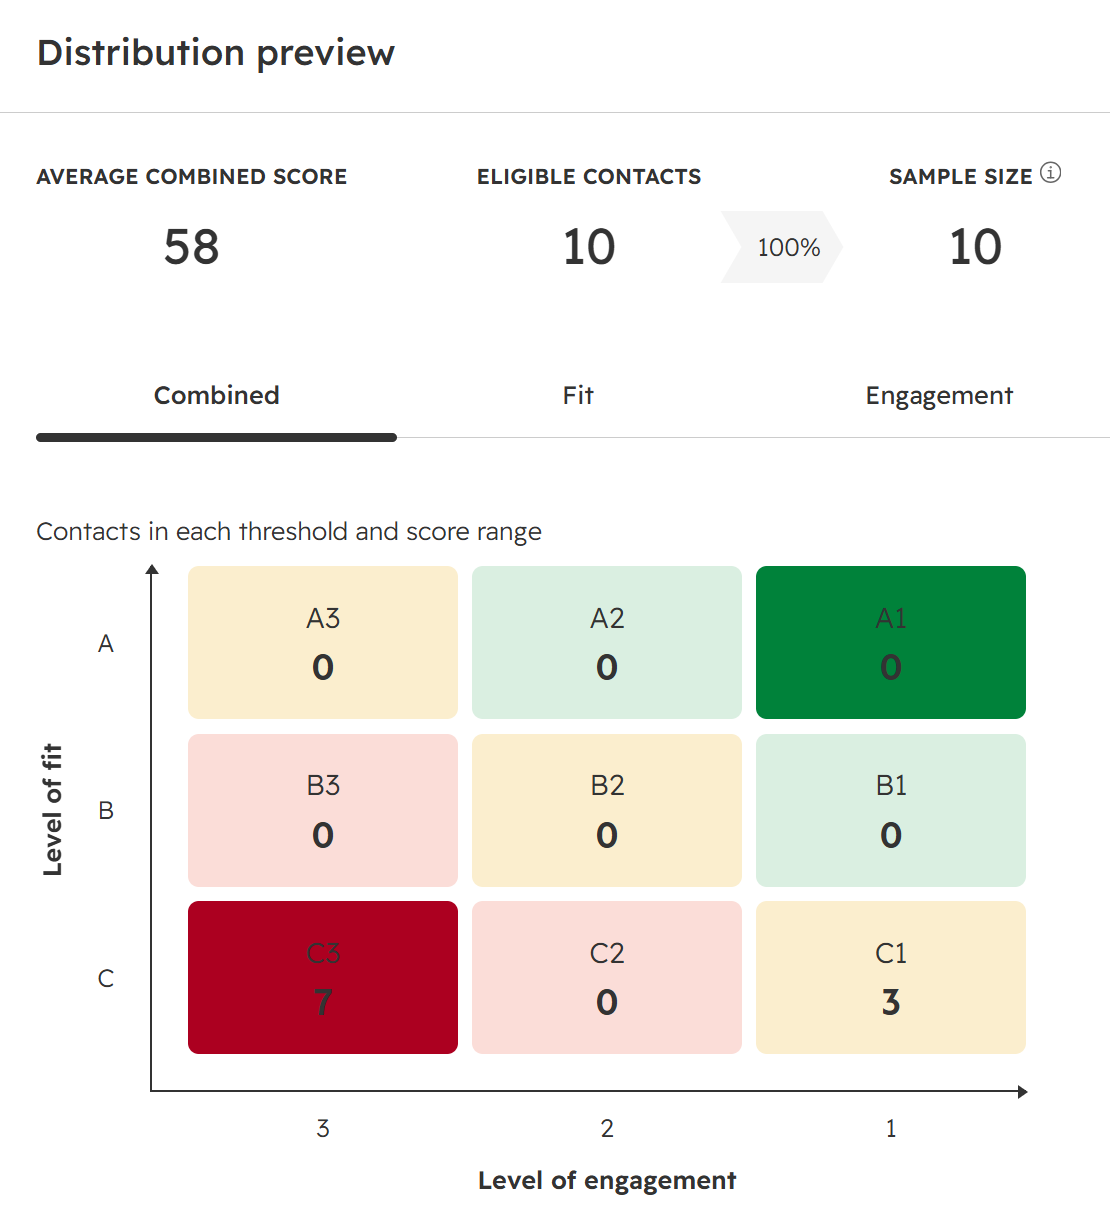
You can use the Preview distribution button on the top right of the screen to get an understanding of what this will look like before you make it live. For a Combined Lead Score you will see it like this initially.
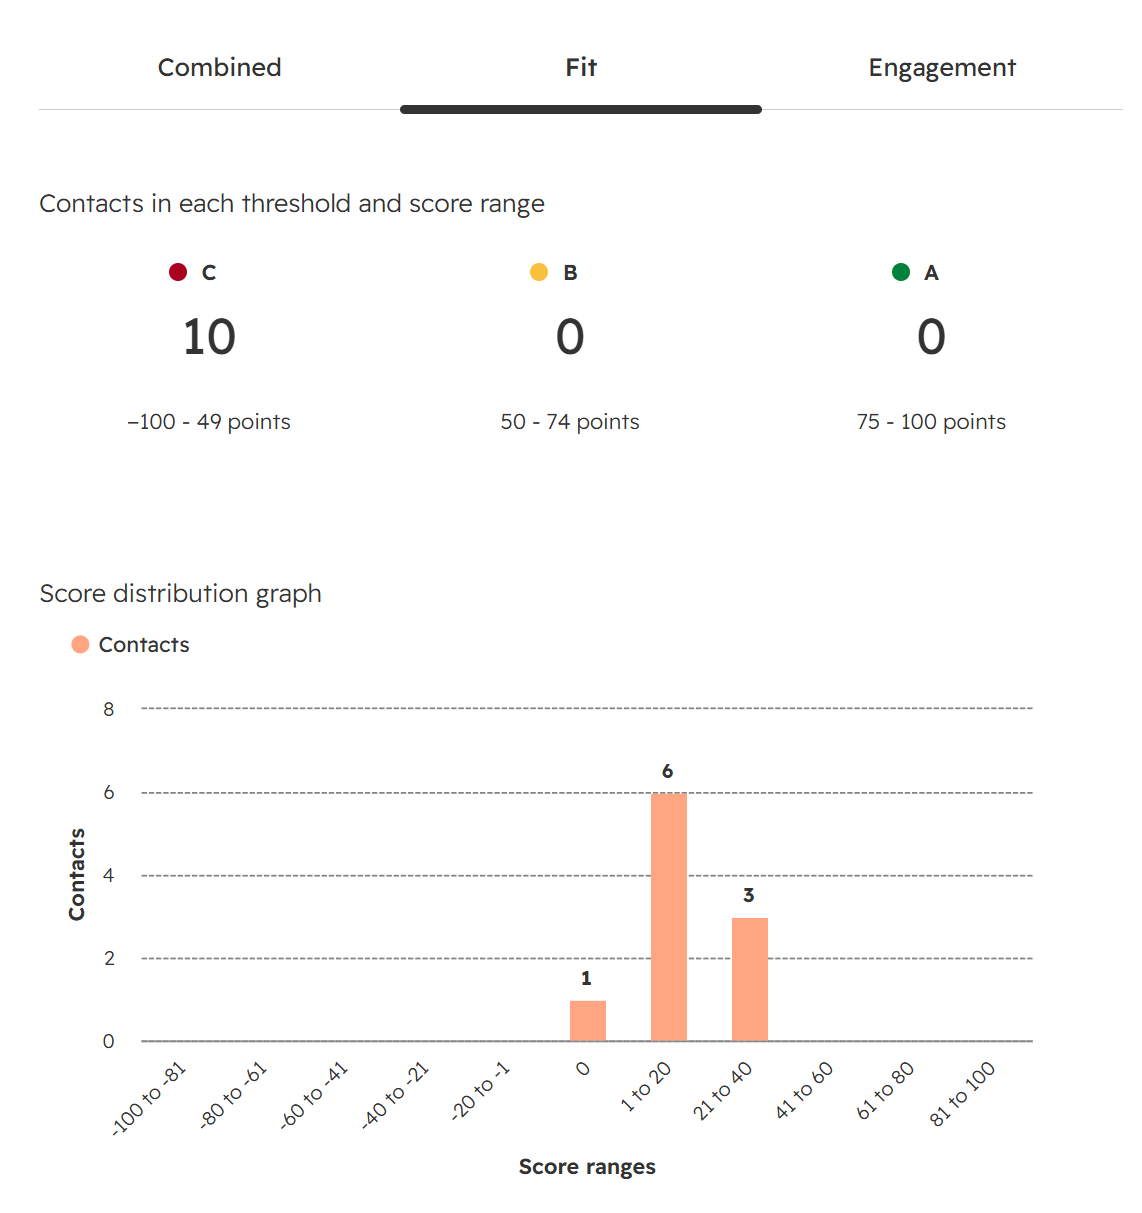
Then you can click on the Fit tab to understand the number of Contacts that fall in to each threshold and score range.
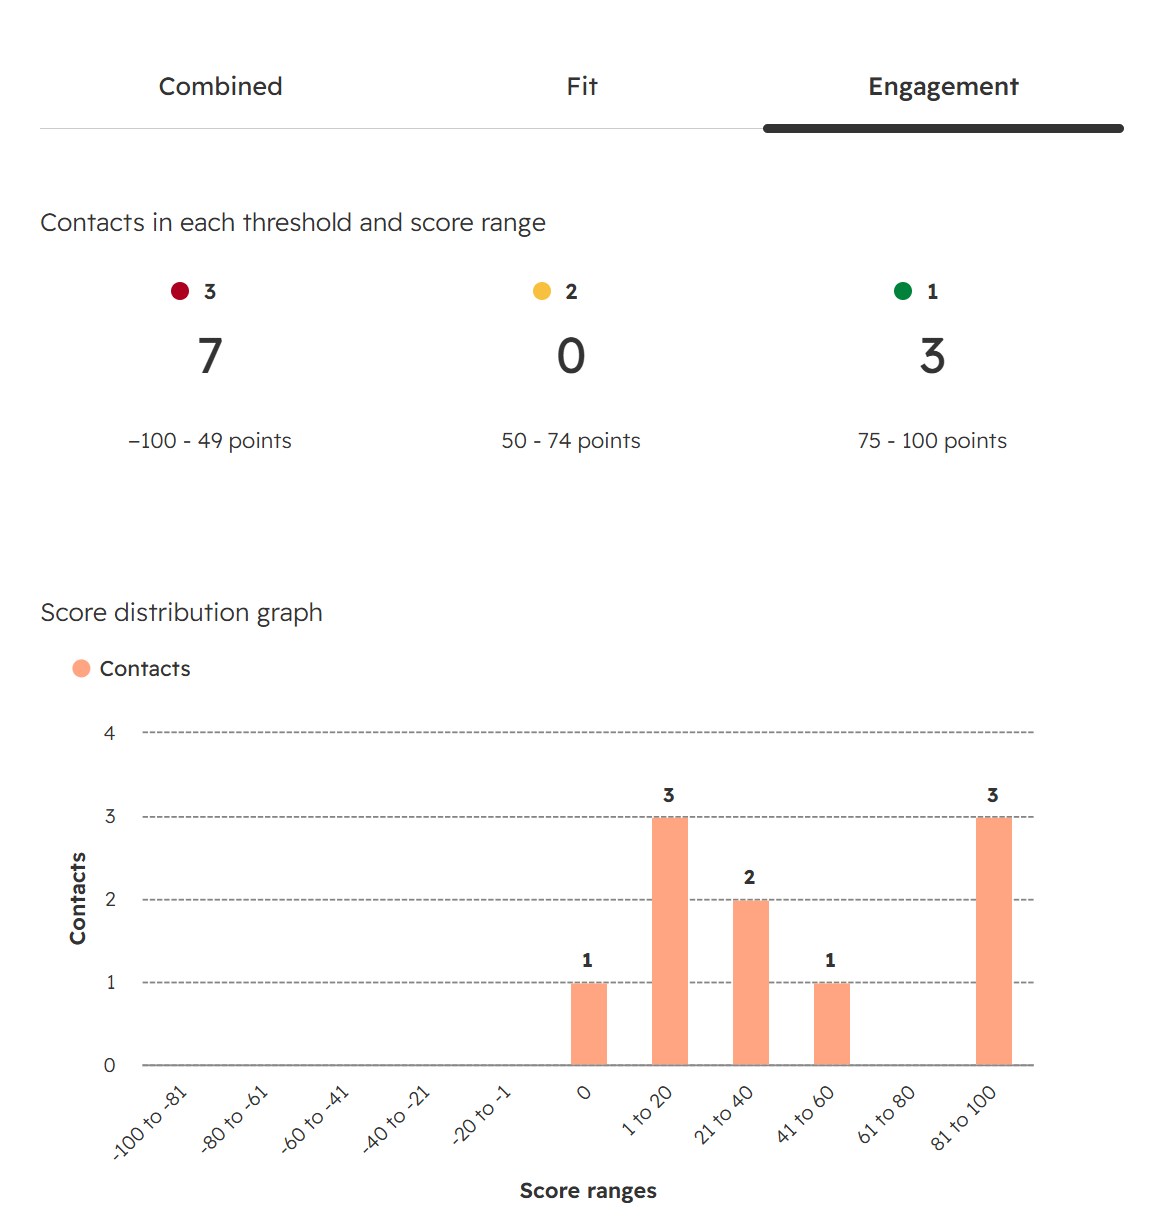
Then finally see the same for the Engagement threshold and score range.
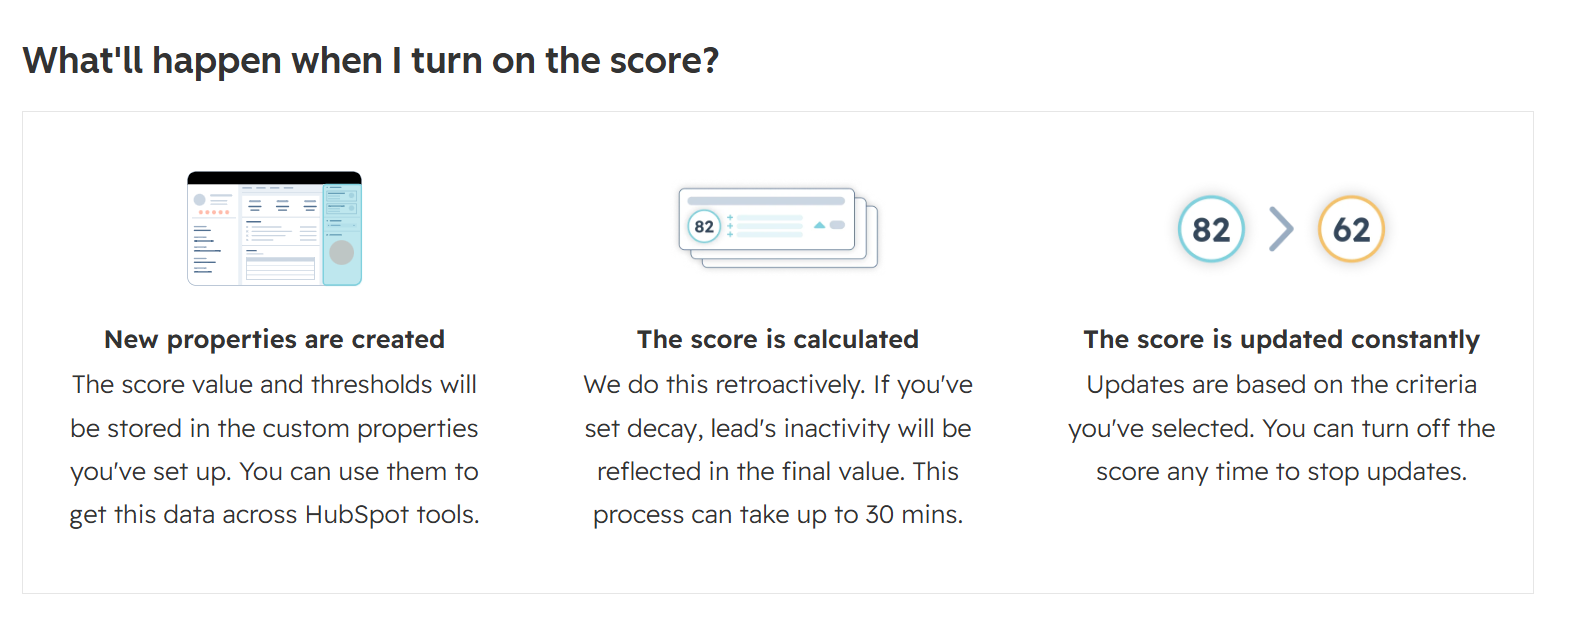
Once you are ready it’s time to turn on the score and make it live!
Understanding and Using Your Lead Scores
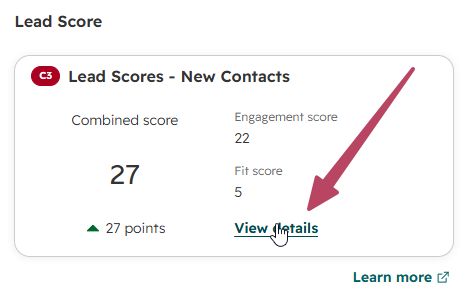
So where can we see this information? First, depending on your set up, you should see a Lead Score card on the Contact record showing you the various scores depending on the type of Lead Score you set up. Here we can see the threshold (C3) along with the Combined Score, Engagement Score, Fit Score and if it has gone up or down and by how many points. Clicking View details will open a pane on the right.
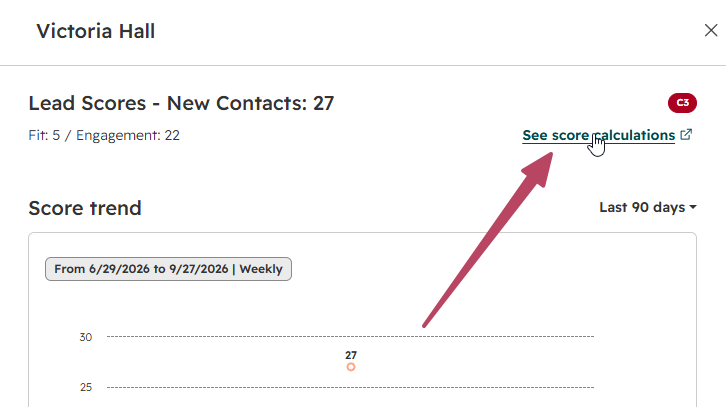
From here, we can see a timeline of all things that happened and when, but even better is the link to see the score calculations rather than it being a black box of mystery.
How cool is this? Here we can see that Victoria Hall matches 5 of the 15 set of criteria, and we can look at each group to see the number of points. Expending a group shows us even more granularity.
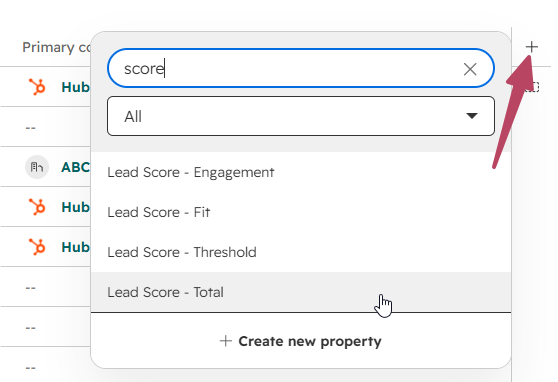
In addition, we have access to the four new properties created when we made the Lead Score live (this shows how important it is to rename these to something logical) and can add them as columns to a view.
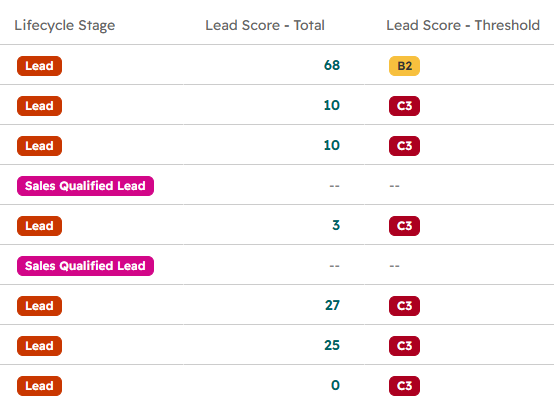
Here we can see the total combined lead score along with the threshold each Contact falls in to.
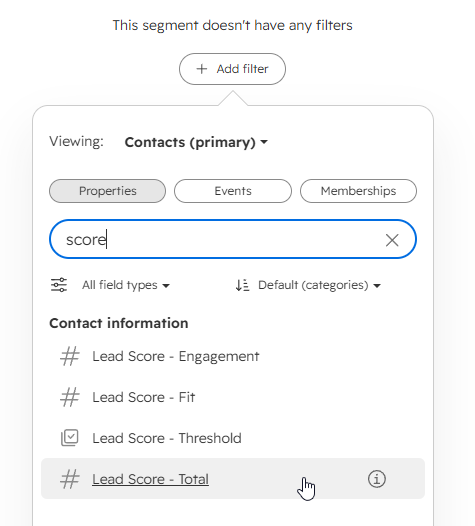
We can also use the properties in segments and workflows as needed.
I love how easy it is to not only set up a Lead Score but also the flexible nature of what can be tracked and when, and decay the scores if we need to. It’s extremely intuitive, and very easy to see EXACTLY what a Contact has done in order to increase or decrease their score.




Leave a Reply