*** NOTE: ALL INFORMATION IS ACCURATE AT DATE OF PUBLISHING ***
I’ve written quite a few articles about Microsoft Clarity and find it such a fascinating tool to use on my own website. They have continually added new features and make improvements to the product regularly. It’s free too, so if you are not using it you are really missing out! I noticed recently there was a new feature available to show Content Insights for your website in Clarity. The insights provide details about the reading and browsing patterns of your site visitors, specifically for your blog posts (articles). I’ve set it up so will show you how to do the same and what you can expect.
First things first, the Clarity documentation site provides an example code snippet to show what needs to be added to your site. Most content management systems such as WordPress already include an attribute or tag on each blog post named article. It’s then a matter of finding that and adding in data-clarity-region=”article” to it.
I use WordPress so I just found the area in my template (do this with caution! Make sure you use a child theme or get someone else to do this for you) where the article tag exists and then added in the part referencing Clarity.
Once added, if I go to a page on my site and view the code, I can see the data-clarity-region=”article” section in there.
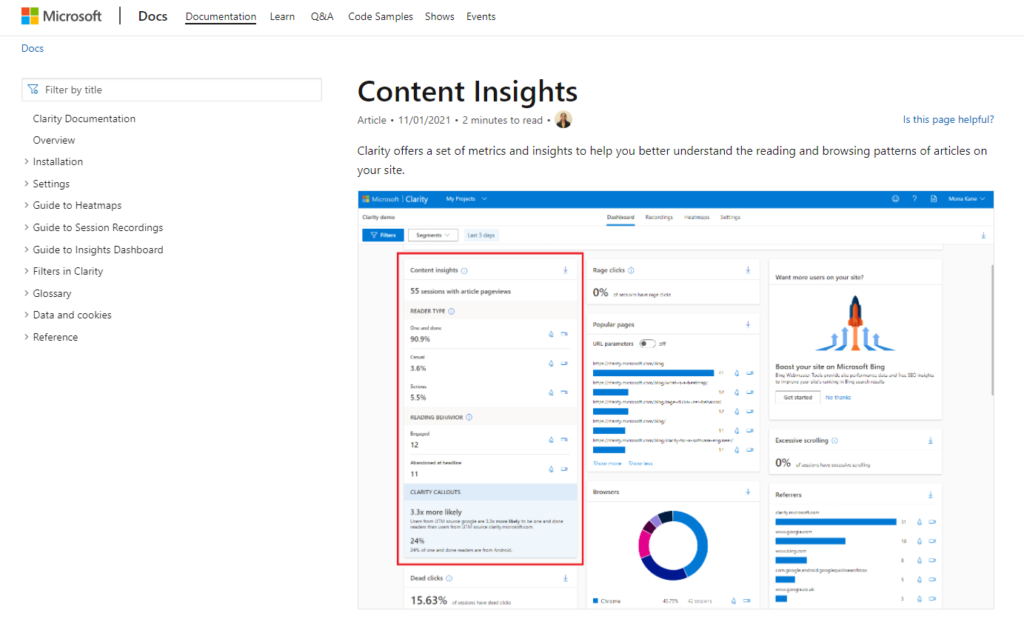
Then we get to the good stuff, the data in Clarity! The Content insights will show on the left of the main Dashboard. It shows how many sessions include article pageviews at the top.
Then we can drill down and see the types of readers and the percentage of those sessions that match each reader type. These definitions are from the Microsoft Clarity documentation page and show how the sessions are categorised in terms of the number of articles being read within a session.
- One and done: Indicates the sessions where users viewed only one article.
- Casual: Indicates the sessions where users viewed 2 to 3 articles.
- Serious: Indicates the sessions where users viewed four or more articles.
Then we see the behaviour of these readers. They are either engaged or abandoned at headline. I am not sure I truly get the definition of ‘headline’ as there is still content on the page below the headline, so likely part of that was read. So it’s probably more likely that abandoned at headline means they didn’t scroll any further and get to the end of the article.
- Engaged: Indicates page views where users finished reading the article.
- Abandoned at headline: Indicates page views where the user only read the article headline.
Finally, there are some callouts based on the data and metrics within Clarity. These are going to be different each time. Good to know I have some serious readers in the Czech Republic! 😊
I can click on either the Heatmaps or Recordings icon next to each of the metrics from the reader type or reading behaviour widgets and this will pass through as a filter to the relevant page.
Opening up the filters panel, we can now see the Reader type as an option.
And then the Reading behaviour as a filter option too.
This is a great new feature! I will be curious to review it in a month or so once I have more data and try and understand a bit more about the behaviour of the visitors reading my blog posts. Do you think you will add this to your website? You can watch a video about this here.
Check out the latest post:
Set A Business Process Flow Stage With Custom Page
This is just 1 of 572 articles. You can browse through all of them by going to the main blog page, or navigate through different categories to find more content you are interested in. You can also subscribe and get new blog posts emailed to you directly.


