*** NOTE: ALL INFORMATION IS ACCURATE AT DATE OF PUBLISHING ***
We can create our own custom reports in Google Analytics. The reports show metrics at the top, with dimensions at the bottom. If we want to see more information on one place, we can create dashboards full of widgets, showing us metrics, timelines, maps, tables, pie charts and bar charts. Dashboards can show us all kinds of information. Let’s look at how to create custom dashboards in Google Analytics.
BONUS: If you would like to simply import the dashboard I made in this post, you can access it here.
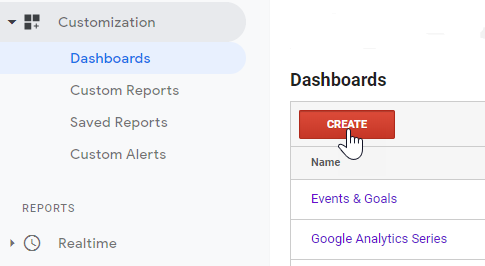
First we navigate to the Customisation area, then to Dashboards. Click on the Create button to create your dashboard.
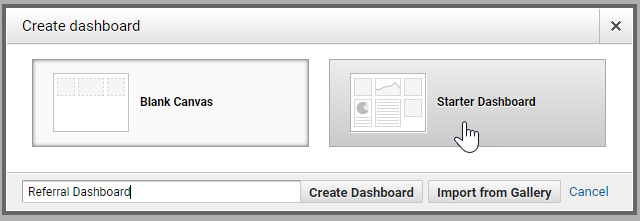
There are two options in creating the dashboard. You can create one with a blank canvas, or use a starter dashboard. Clicking on the Starter Dashboard we can see what gets created. Give the dashboard a name and then click Create Dashboard.
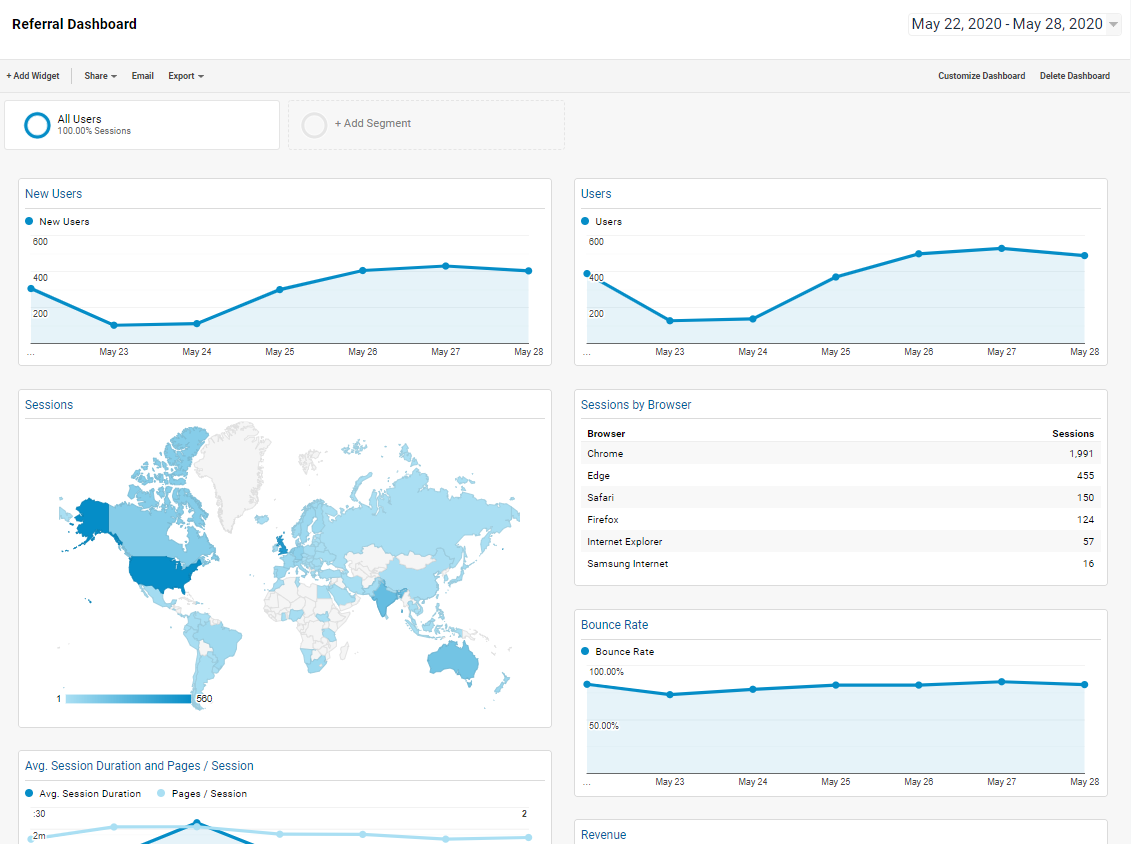
A series of widgets will be added to the starter dashboard. Although it’s a good way to see the kinds of things you could add, it’s likely not going to give you what you need. So, we will go back and start again, this time adding a blank canvas.
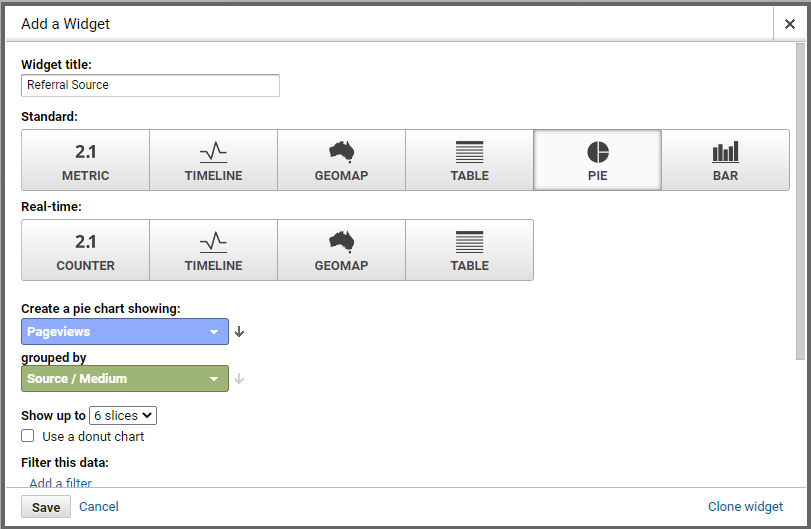
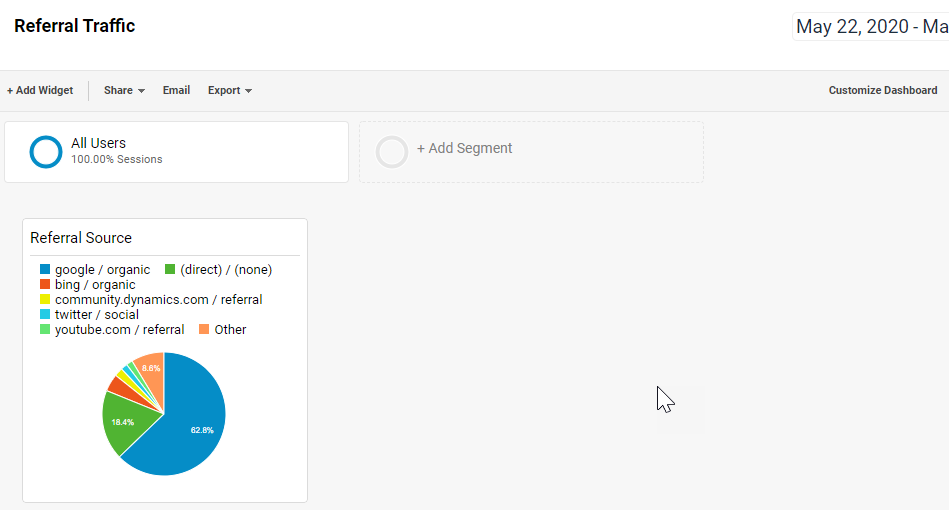
As soon as you click Create Dashboard, you will be prompted to add your first widget. We can select from a series of 6 standard widgets, or 4 widgets that will display real time data. In this widget, I’ve picked a Pie chart to show the percentage of pageviews grouped by the source and medium.
Once the widget has been saved, you’ll see it displayed on the new dashboard. Click on the Customise Dashboard button at the top.
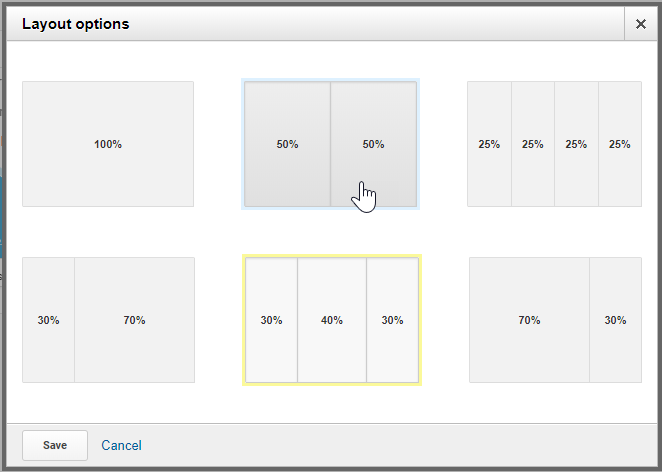
We can see that there are a variety of layout options. Review and select your preference.
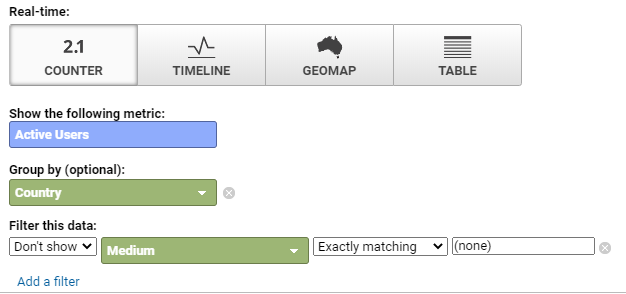
Adding another widget, I’ve picked a real time table widget to show the active users by traffic type, source and medium.

Make sure you change the title of the widget so it makes sense for you and anyone you might share the dashboard with. In this widget, we are using a counter which will display the number of current users on the site by Source.

The last thing I’ve done on the report is to filter out all of the traffic that is direct. I only want to see the referral traffic that came from somewhere else, rather than the traffic when someone just typed out the website and went there directly. If you want to add a filter to a widget set it to ‘Don’t show’ with the medium ‘exactly matching’ (none).
Here we can see the finished Dashboard. You’ll be able to find your Dashboard immediately in the Dashboards section from the Customisation area on the main menu.

BONUS: If you would like to simply import the dashboard I made in this post, you can access it here.
Want to just watch how to do this? Check out the video: https://youtu.be/Nr3ZjkBTTlA
Check out the latest post:
Adding Multiple Screens To A Custom Page To Provide Confirmation Of New Record Creation
This is just 1 of 576 articles. You can browse through all of them by going to the main blog page, or navigate through different categories to find more content you are interested in. You can also subscribe and get new blog posts emailed to you directly.