*** NOTE: ALL INFORMATION IS ACCURATE AT DATE OF PUBLISHING ***
In the post yesterday, we looked at using Google Optimize to do A/B testing on a website page. Using Google Optimize gives us the ability to create a new experience, set an objective, then test several variances to see which one performs best to help you meet your objective. In this post, let’s look at the reporting for the experience in both Google Optimize and Google Analytics.
From Google Optimize, logging in should take you to your dashboard and an overview of all existing experiences. We can click on the name of the experience to review further.
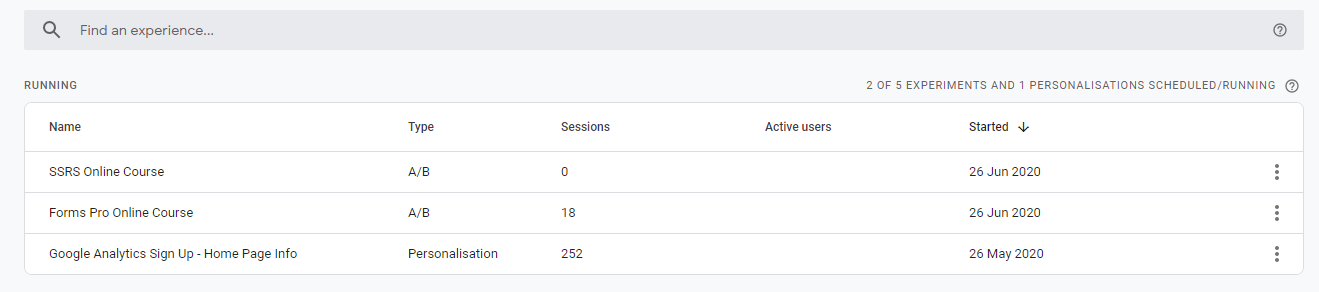
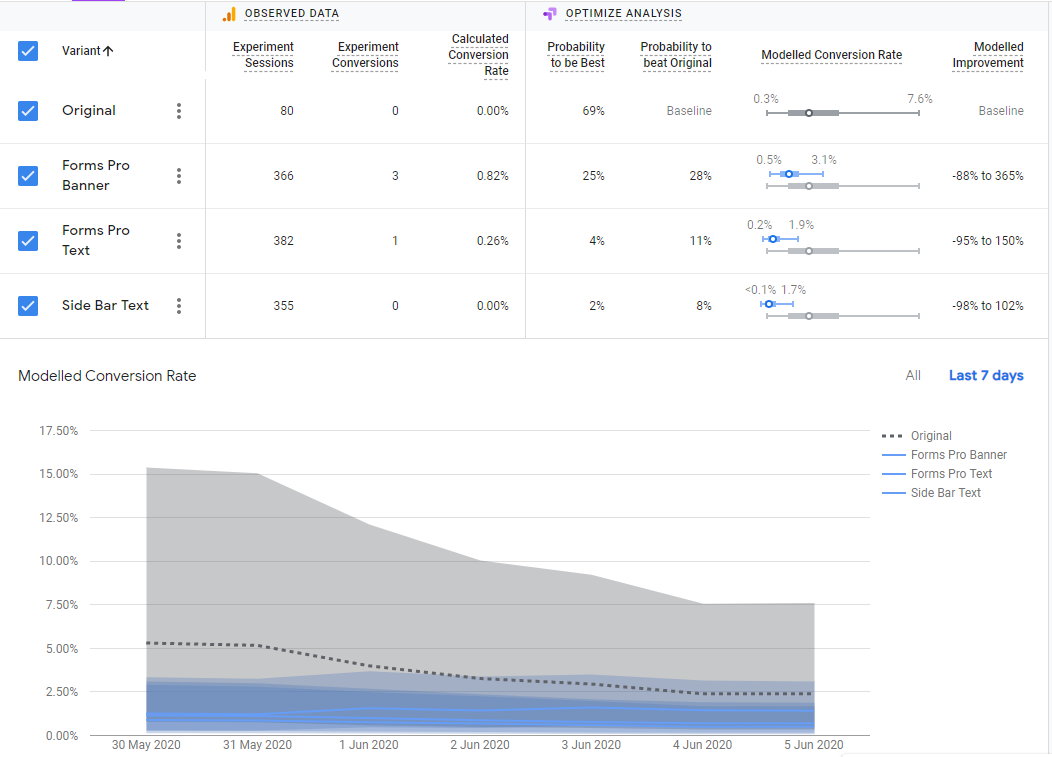
From here, we can see the different variants, including the original one. It shows how many times the variant was shown, how many times the experiment converted to meet your objective, and the calculated conversion rate. This is all based on the Google Analytics data. We can then see the Optimize Analysis and see which variant has the highest probability to best the original. Next, we can click on the link to View a report in Google Analytics. Clicking on that will take us directly in to the related Google Analytics account.
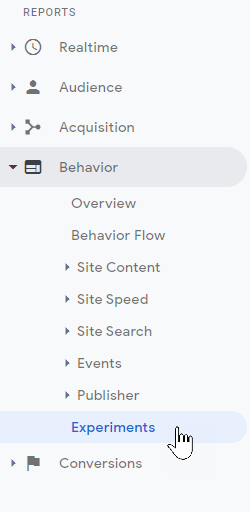
We can get to the report directly from Google Analytics too, which is done by going to Behavior, then Experiments.
From there we can see all of the Google Optimize experiments. We can then click on the name of one to see some reporting.
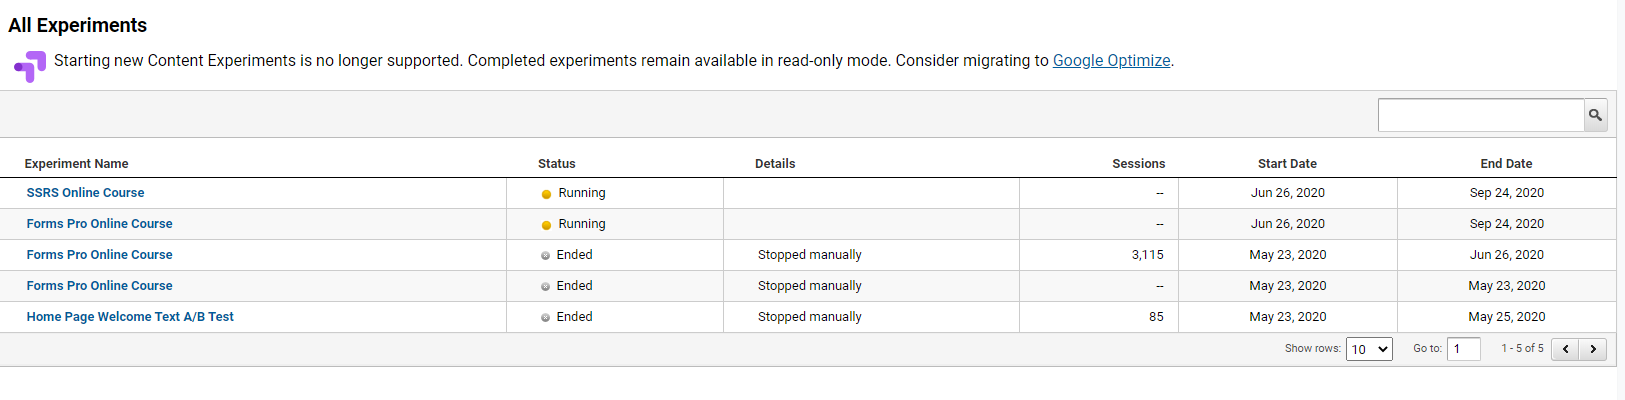
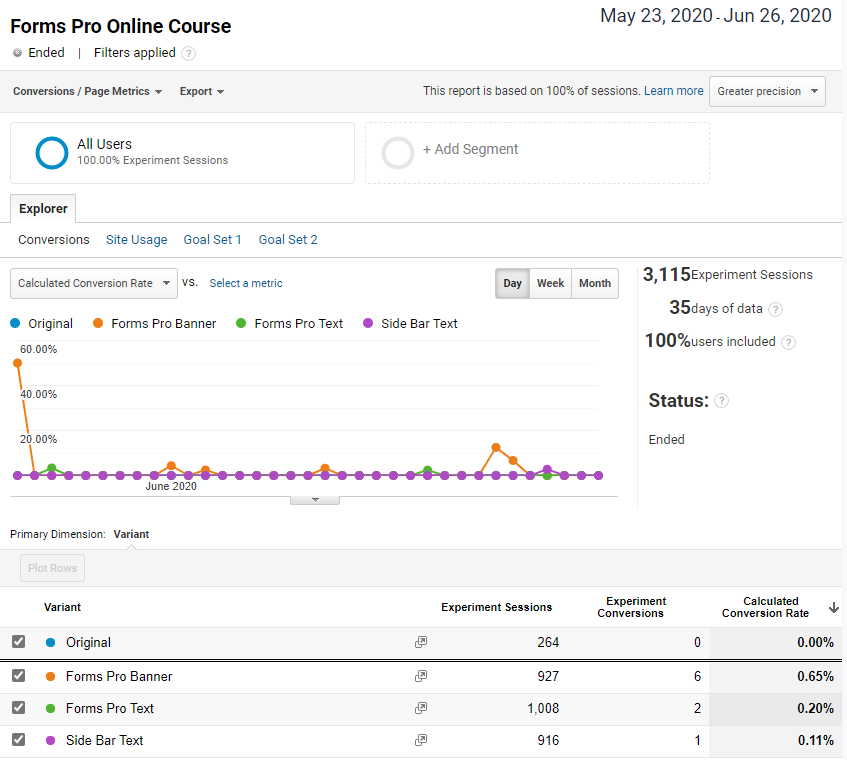
First, we can view the conversions for the experiment. We can see how many sessions were in the experiment for the time frame selected, how many days worth of data, and how many users were included in terms of a percentage. At the bottom of the report, we can see the sessions broken out by variant. The Experiment Conversions will show how many times the objective set on the experiment was met. Finally it will show the calculated conversion rate for each variant. This is great if you are trying to determine a new layout for your web page and want to make adjustments to it, but want to try out your experiment first. Now I know that the Forms Pro Banner variant seems to have the most interaction from site visitors.
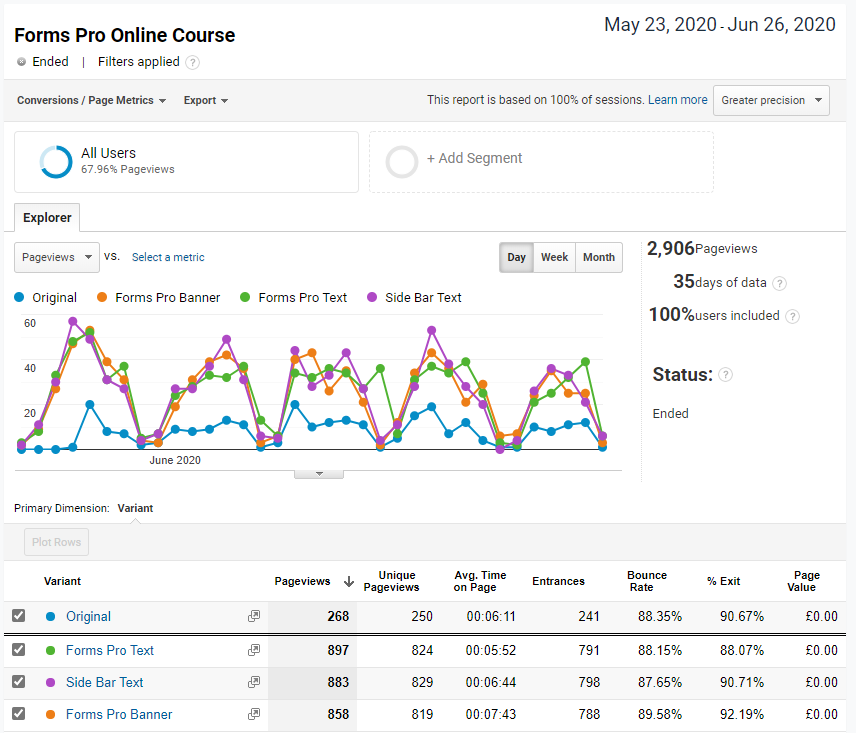
Clicking on the dropdown for Conversions/Page Metrics, we can change it and review the Page Metrics instead. So now we see the number of page views, unique pageviews, average tie on page, entrances, bounce rates, % exit and page value (if you have this tied to a monetary value).
Once you know which variant is working out the best, you can then make the decision to actually change the web page directly for your website rather than continuing with the experiment.
Want to just watch how to do this? Check out the video: https://youtu.be/Y0nuTmxkluM
Check out the latest post:
Setting Up reCAPTCHA v2 For Your Realtime Marketing Forms
This is just 1 of 571 articles. You can browse through all of them by going to the main blog page, or navigate through different categories to find more content you are interested in. You can also subscribe and get new blog posts emailed to you directly.