*** NOTE: ALL INFORMATION IS ACCURATE AT DATE OF PUBLISHING ***
Now that you’ve been reviewing your data in Google Analytics, hopefully, you are starting to find what’s most valuable and useful to you. Having reports you can easily view, with information that works for your needs makes your analytics a lot more powerful. In this post, we will look at creating custom reports in Google Analytics.
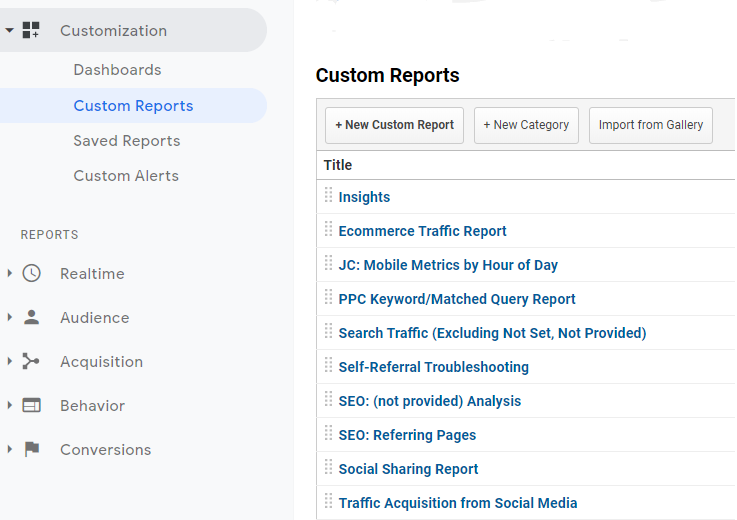
First, navigate to the Customization area, then Custom Reports. Click on +New Custom Report.
We can give the report a title, then select the information we want on the report tab. Using the type of explorer, we can select the metrics we want to review, then a dimension.
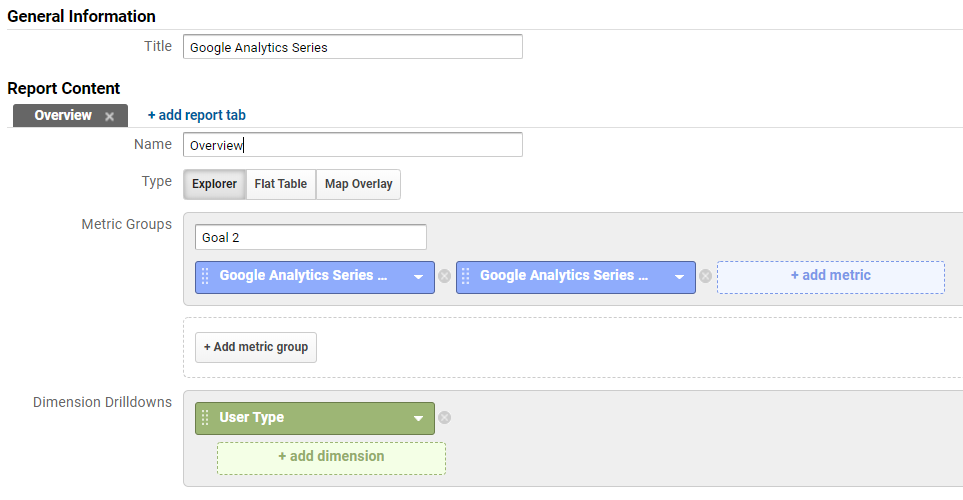
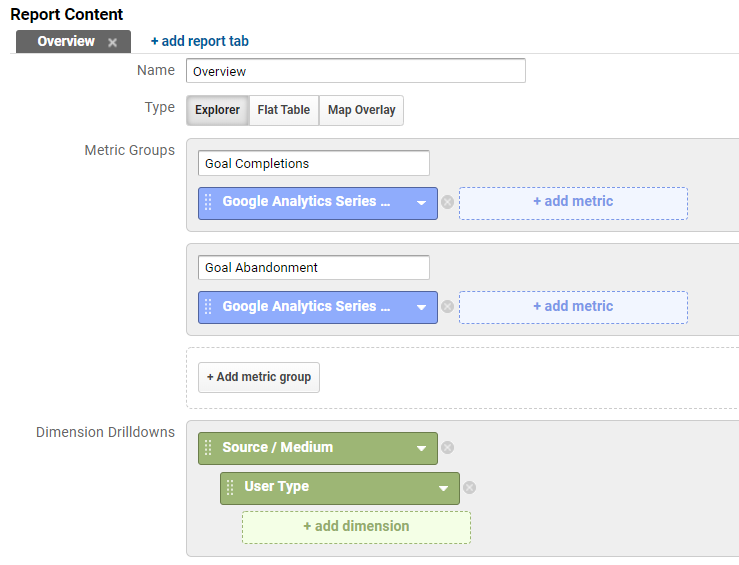
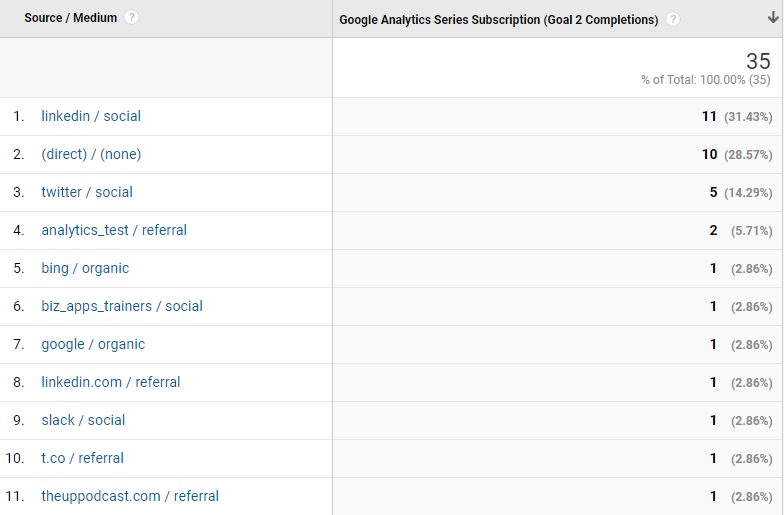
Adding separate metric groups will provide the report viewer with different sections at the top of the report. We can give each metric a name so it’s clear what is being reviewed. In this example, we will see the completions and the abandonment for a specific Goal set up in Google Analytics. In the dimensions, adding additional ones gives us a path to drill down into the data further. We can then save the report.
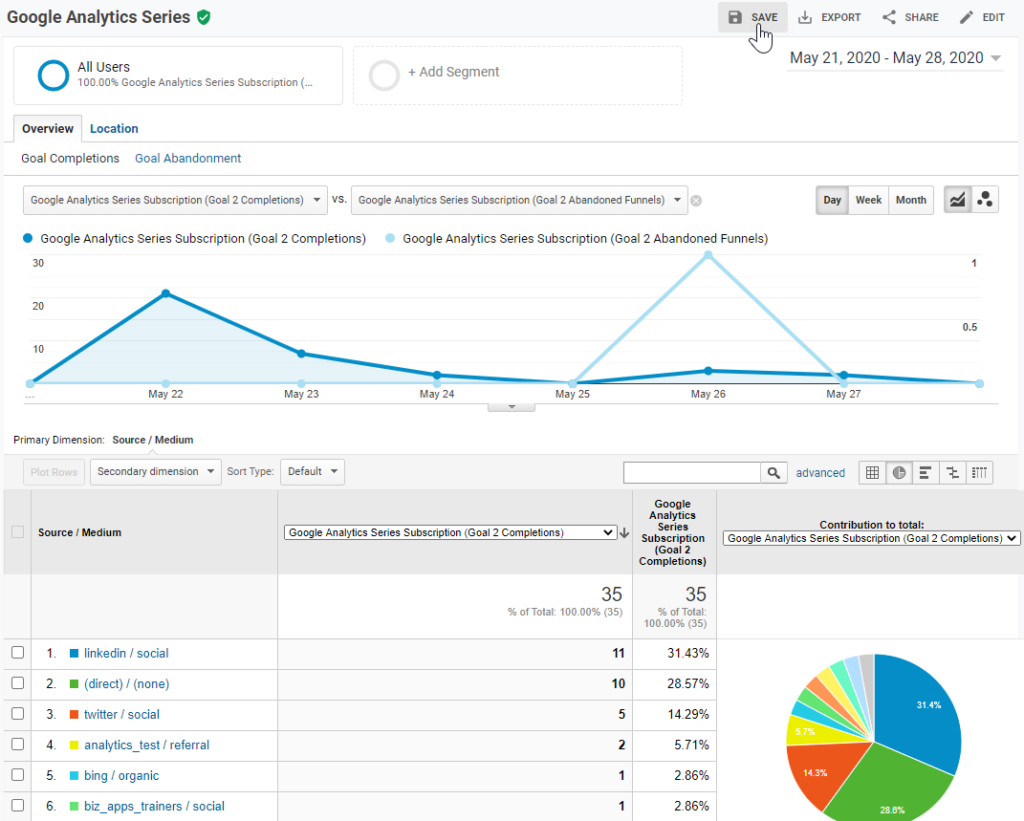
The top of the report will show the metrics. We can compare the completions with the abandonments. We can also change the timeframe to look at a specific set of dates.
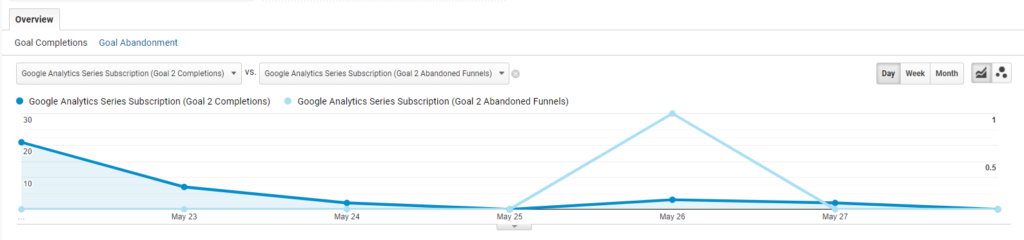
The bottom part of the report is where we see the top level dimension selected. If there is more than one drill down, you will see this is a hyperlink. Clicking on a dimension will take you to the next one and so on until you get to the bottom drill down.
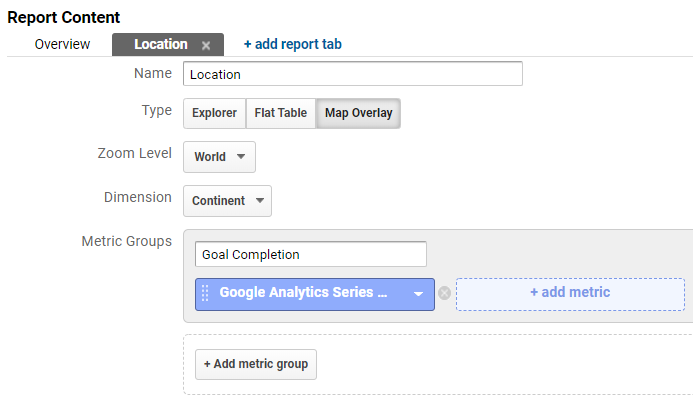
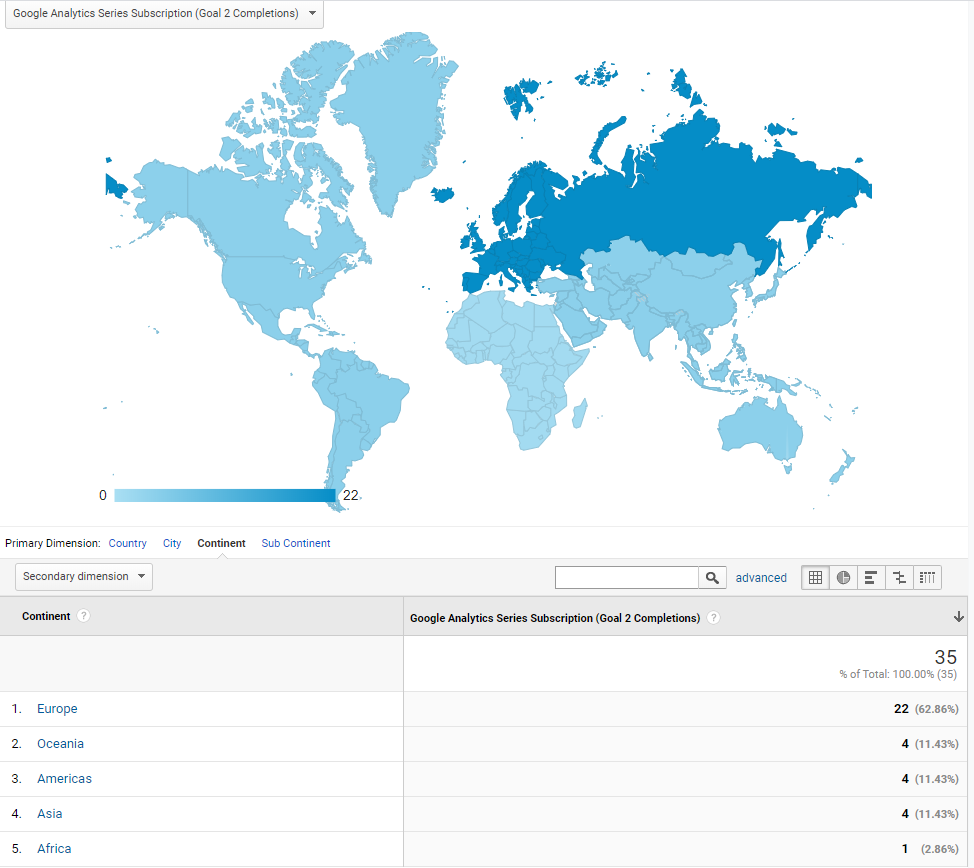
We can then edit the report again, this time adding in a new report tab. With this one, we are adding a Map Overlay to show the number of Goal Completions. You can change the Zoom Level and the dimension to start from. From the Continent we can then drill in to the Country, City etc.
Saving the report and viewing it again, we can now see the map overlay with the dimensions at the bottom.
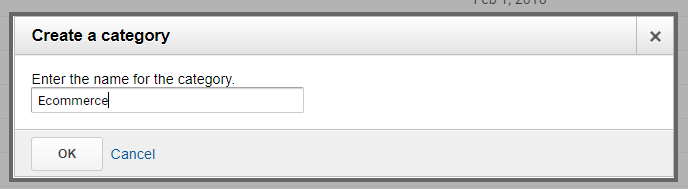
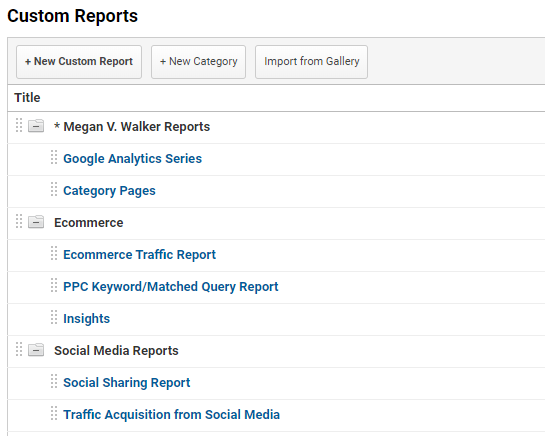
Once the report has been saved, you will see it in the Custom Reports area. You can create categories for your reports.
Then drag the reports in to your categories to make it easier to find what you’re looking for.
Another option with your Custom Reports, when you are viewing it, you can make changes to it by adding segments, comparisons and add charts etc. Once you have the report the way you want it, click the Save button at the top.
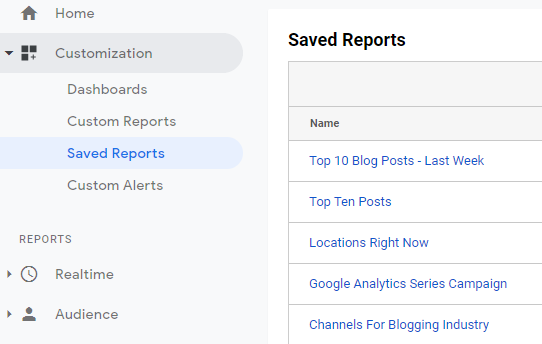
You will then find the version you modified in the Saved Reports section. If you go back to the report within Custom Reports, it will be the original version that you see, and is where you can then edit the report from if needed.
Start thinking about the type of data you want to analyse and begin creating your own custom reports.
Want to just watch how to do this? Check out the video: https://youtu.be/vb3rA9XNV0o
Check out the latest post:
Adding Multiple Screens To A Custom Page To Provide Confirmation Of New Record Creation
This is just 1 of 576 articles. You can browse through all of them by going to the main blog page, or navigate through different categories to find more content you are interested in. You can also subscribe and get new blog posts emailed to you directly.