*** NOTE: ALL INFORMATION IS ACCURATE AT DATE OF PUBLISHING ***
If you are in the Power Platform world you might be thinking…. oooh Flows! Power Automate! Nope, not here, but Flows do also exist in Google Analytics. There are several flow reports. The User Flow of your Audience, the Behaviour Flow of the Users, the Users Flow from Social traffic and the Events Flow. Each report shows the path taken through your site, with slightly different variations for the three topics. Let’s look at each one and get an understanding of how they can give us valuable insights into the journey people take through your website.
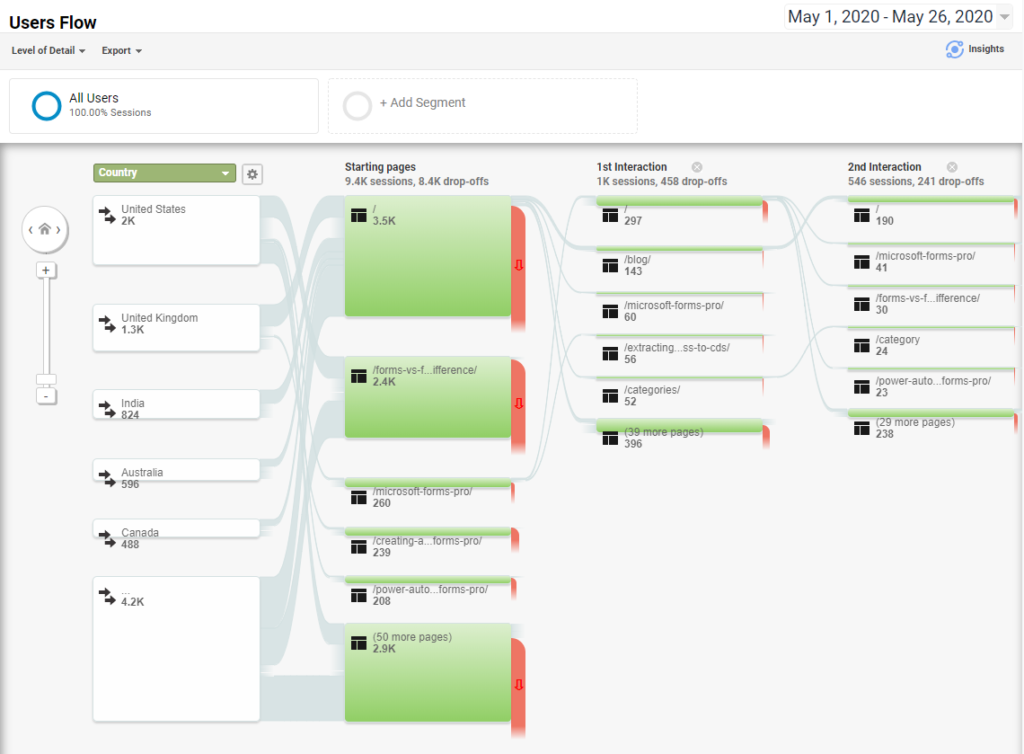
Looking at the Users Flow report we can see the paths users took through your site. The graphical overview shows where the journey started (based on their country in this example, but this can be changed), then the path users took and where they exited or left your website. The report parameters can be changed giving you the ability to compare traffic from different sources, examine traffic patterns through your site, and troubleshoot any areas of your site that might cause people to leave on a regular basis .
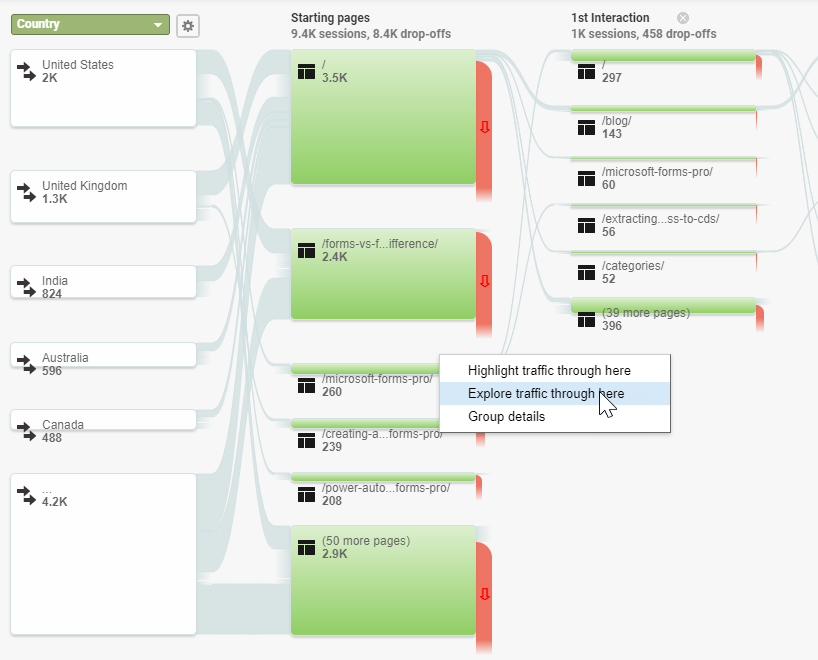
Clicking on a section provides a menu. Here we can highlight the traffic that came through that specific page of the site. We can click Group details to get a pop up giving more in-depth information, or we can click to explore the traffic that went through a specific page. In the screenshot below, we can explore the traffic that has gone through the Microsoft Forms Pro page I have set up on my site.
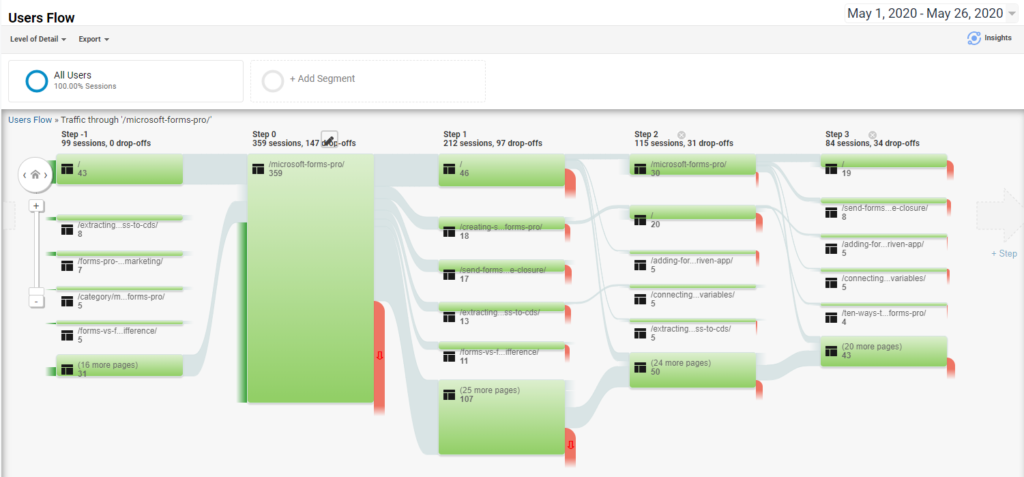
Now we can see Step -1 which is the original starting page for some of the visits to this page. Step 0 is the Microsoft Forms Pro page, then the next steps show where someone travelled after visiting that page.
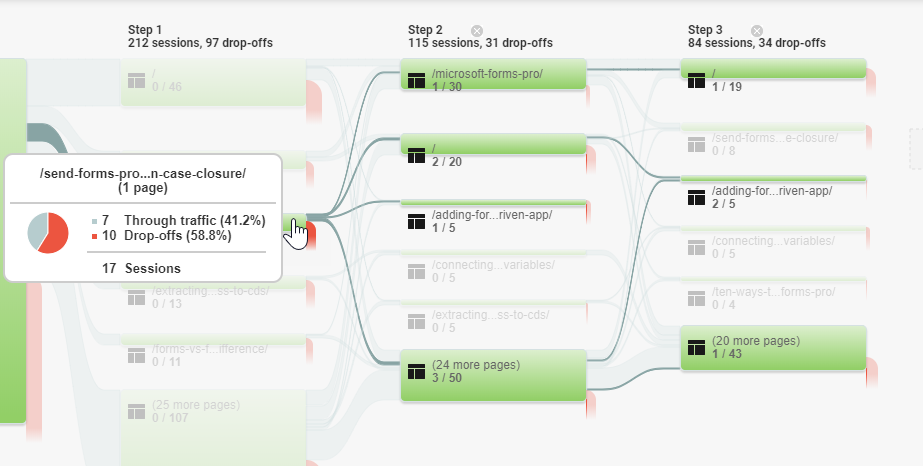
We can hover over a section to see what the page was, then the percentage and number of through traffic sessions and the same for the drop-offs. The steps may continue on through several sections for as long as you still had a session continue through your website. For some of mine, they might continue on for 12 ore more steps and show all of the interactions that occurred.
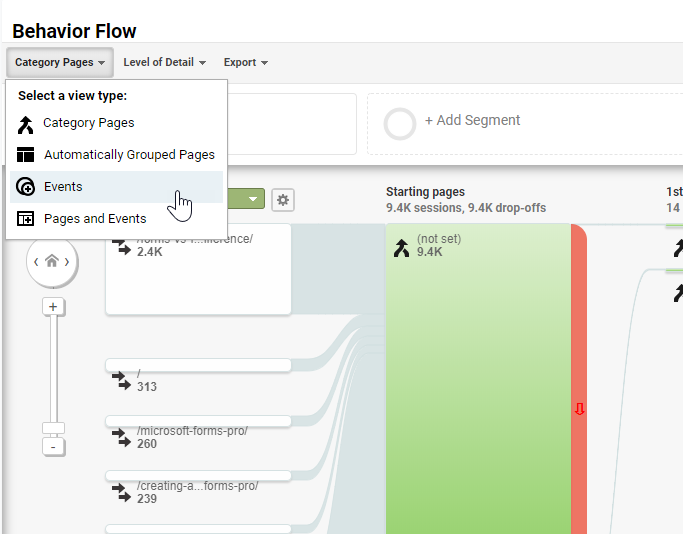
For the Behaviour Flow, this gives you the ability to analyse the data just by viewing the Pages (or Grouped Pages), or just viewing Events, or looking at both Pages and Events at the same time.
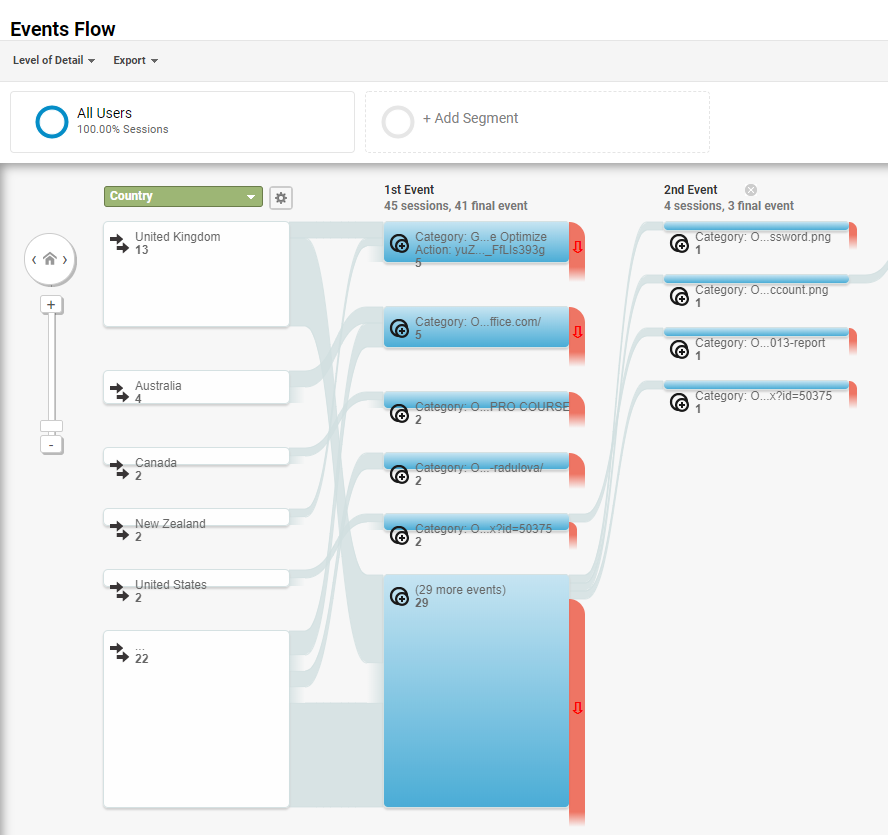
The Events Flow can also be viewed but is the same as the Behaviour Flow report above when set to just show Events. Here, instead of Sessions, it’s showing Events that have been triggered by users. With the events you can see which areas of your site might help to keep users engaged and the path between events. If a user triggers one event such as downloading a whitepaper, then goes on to download another piece of content, and you see this path between the two pieces of content consistently, this gives you good insight. Your marketing is working between the two, and you’ve gauged the users interest correctly.
If you don’t have many pages on your website, the flow reports might not tell you much. However, if you’ve got a site set up with different subdirectories, or a ton of blogs interlinked with one another, these reports should give you some insight in how well you’ve understood or anticipated what your users journeys could look like on your website.
Want to just watch how to do this? Check out the video: https://youtu.be/M0JQyb1Zv88
Check out the latest post:
Open Custom Page For Multiple Selected Records In A View Or SubGrid
This is just 1 of 597 articles. You can browse through all of them by going to the main blog page, or navigate through different categories to find more content you are interested in. You can also subscribe and get new blog posts emailed to you directly.