*** NOTE: ALL INFORMATION IS ACCURATE AT DATE OF PUBLISHING ***
We know how many visitors we are getting to our site, and we know a bit about them in terms of the demographics, interests and location. We also know we acquired them, be it from a referral site, social media or organic search. What about knowing what they did when they reached our site? Where did they go, what did they click on, and how did they navigate through the pages? In this post we will look at the Behaviour of your website visitors.
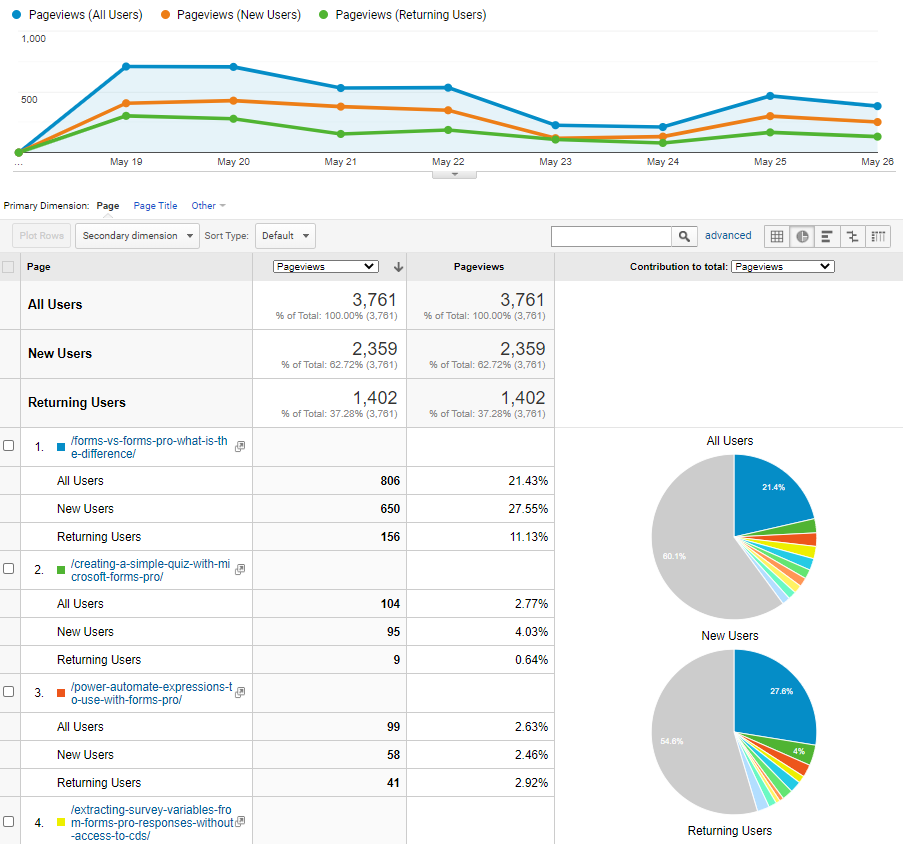
In the menu for Behaviour, we can get an overview report showing the number of page views, unique page views, average time on page, bounce rate and the exit rate. We then get a list of all pages that have been viewed. Skipping over the Behaviour Flow (for now, don’t worry, there will be a post all about this!), we can go to the Site Content and look at all pages. From the top of the report, add in some additional segments (ways the data is split up) and add Pageviews for New Users and Pageviews for Returning Users. Now we can see all of the page views and get an idea of how many are from new versus returning visitors. For each page, we get a break down using the same segments. For the top-performing page on my website (Forms Vs. Forms Pro), most of the people visiting are New Users, which is what I would expect. People are interested in knowing more about Forms Pro, so it’s a good starting point. However, I can also see that I get a decent amount of Returning Users, which means some are using it as a reference guide which is also good insight. We can also add in a piechart to get a visual to go alongside the list of pages on the left.
Next is Content Drilldown. This shows all of the site visits but by the path on your site. So, for example I have pages for Categories, which then show all of the Categories in a list. From there, the blog posts are grouped by showing 10 per page. When people navigate through to the next group of posts, it adds a new page folder. Below we can see clicking on /categories/ takes us to all of the categories on the site. Clicking on /microsoft-forms-pro then shows a /pages/ directory, with 7 pages worth of posts. We can drill all the way through and see the Pageviews, Unique Pageviews and other statistics for each level of content. If you don’t have many ‘levels’ to your content this might not be as interesting.
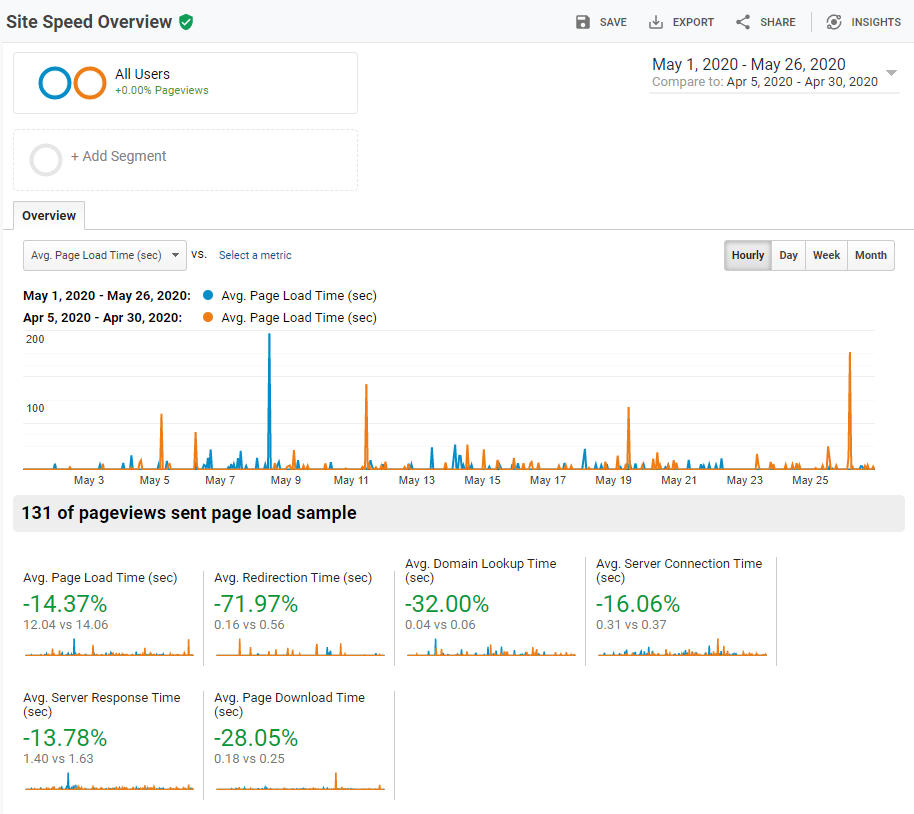
We can also look at the site speed experienced by the users. On the overview we can see a comparison of May with the same time frame in the previous month. I made some changes to my site in May, so we can see some improvement, but there is definitely room for more changes to try and reduce the average page load times. You can see spikes within certain days which obviously can increase the average, so it’s good to try and understand what might have happened during that time. Did you do work on your site? Update any of your plugins, or do any customisation? That might account for any spikes seen.
We will take a look at the Site Search, Events and Experiments in other posts. For now, get used to understanding the site content reports and getting an overview of where your visitors are going on your website.
Want to just watch how to do this? Check out the video: https://youtu.be/1ohQZ0FVslM
Check out the latest post:
Use Custom Event Registration Questions To Branch Your Journeys In Customer Insights
This is just 1 of 603 articles. You can browse through all of them by going to the main blog page, or navigate through different categories to find more content you are interested in. You can also subscribe and get new blog posts emailed to you directly.