*** NOTE: ALL INFORMATION IS ACCURATE AT DATE OF PUBLISHING ***
If you’ve only read my content for the past few years, you might be forgiven for thinking that the ‘only thing’ I work on is Marketing (Customer Insights – Journeys). I started my CRM/D365 life working on Sales and Customer Service, love to work on Portals projects, use Power Automate and many other Microsoft products and tools. One of the things I love when working with clients is helping them discover what is already there out of the box, nothing they have to pay for, and they just need to start using it. This happened the other day when talking about Opportunities. I happened to show the Pipeline View, and it was new to them. I figure it’s maybe still new to others, so this post will walk through this out of the box control that you can add to any of your own views in Dynamics 365.
First things first, open up Dynamics and go to your Opportunities. Click on the top left where it has Show As, and click on Pipeline view. If you don’t see this, don’t worry, more at the end on how to add it.

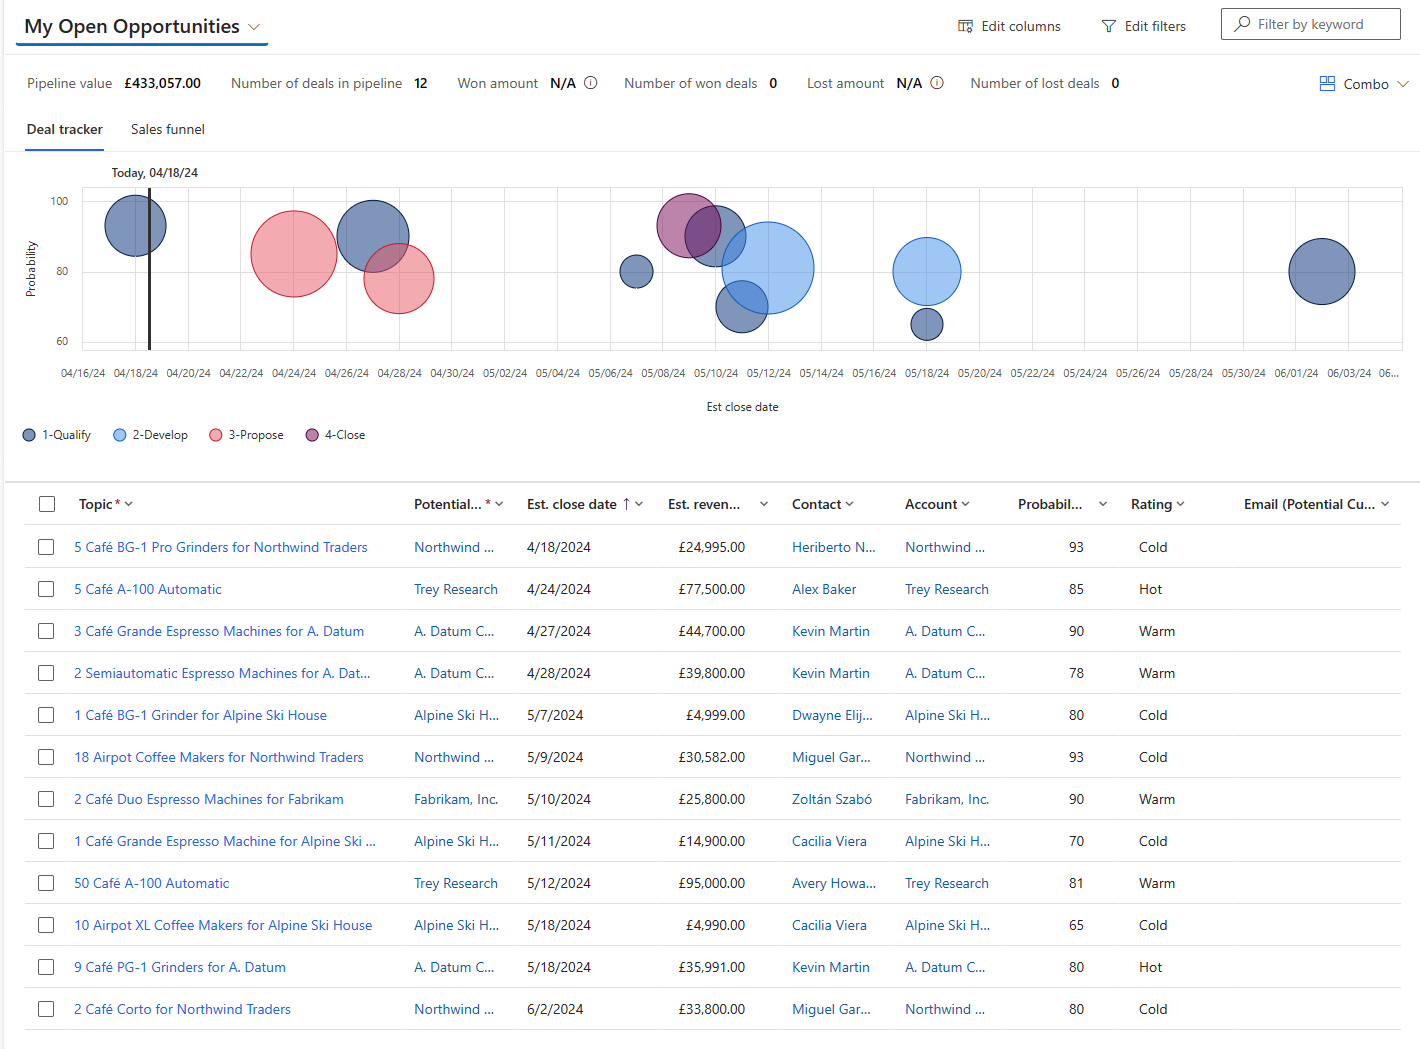
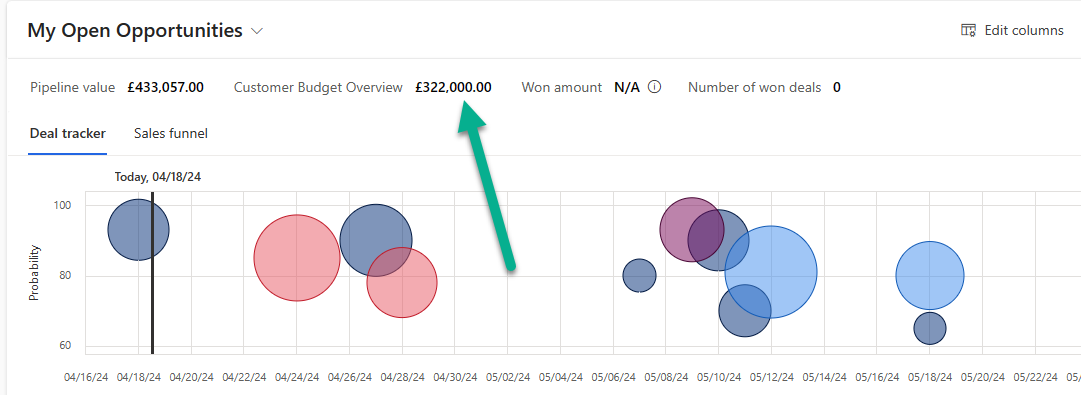
Once you change it to the Pipeline View, you see this beauty. The top part will include a bubble chart. The bubbles vary in colour based on the current stage of the related Business Process Flow they are in, and vary in size based on the estimated revenue. We can see a series of metrics right above that, and a list of all the opportunities below that.
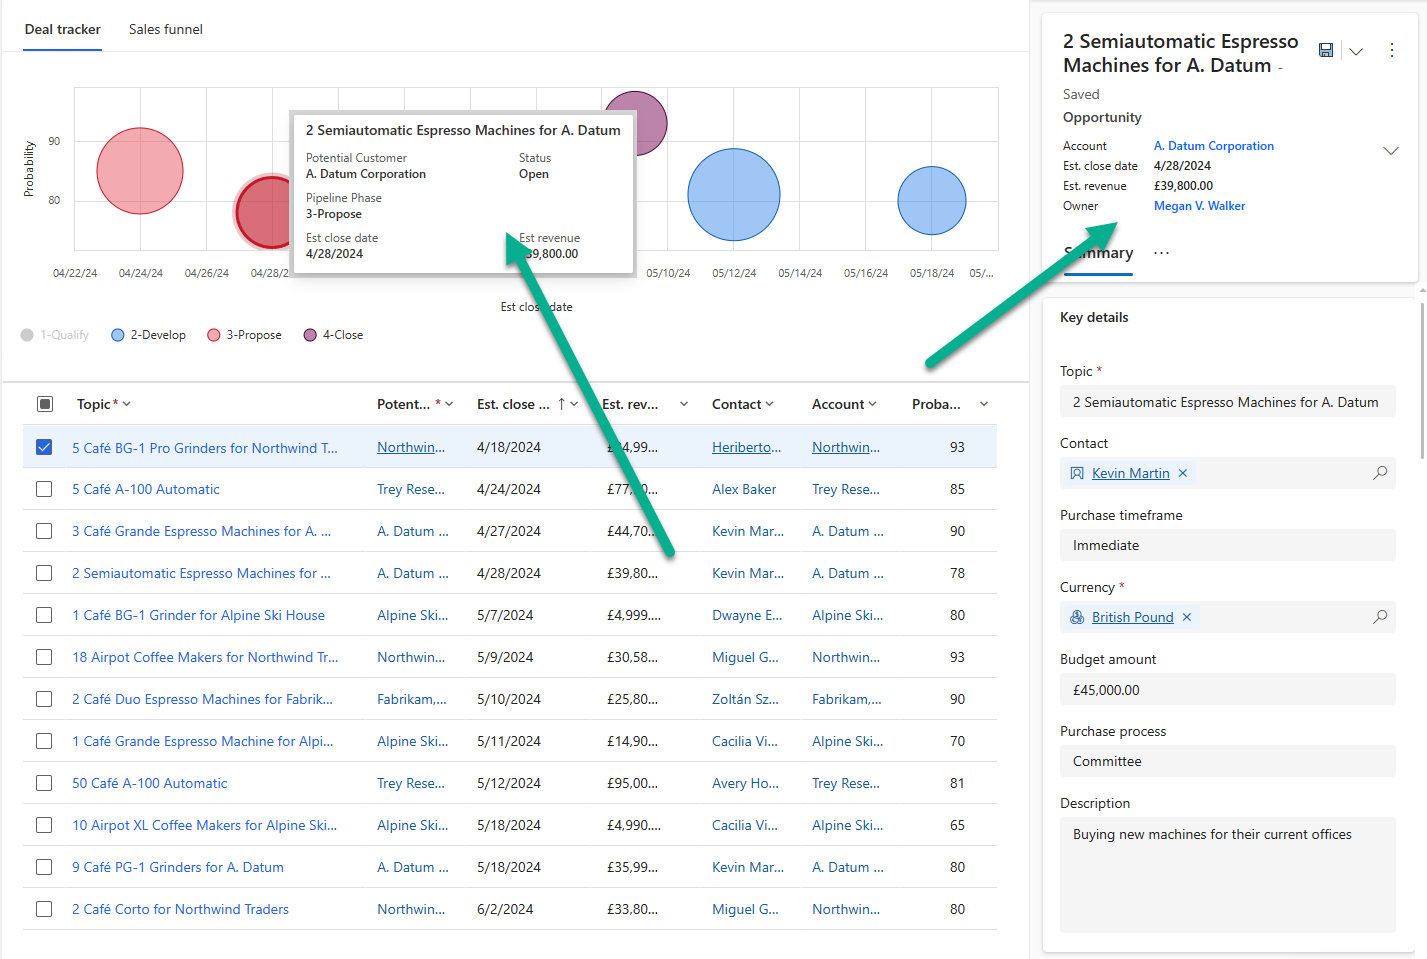
Hovering your mouse over a bubble will give you a little pop up with some information, and clicking on the bubble will open the record in a side panel form.
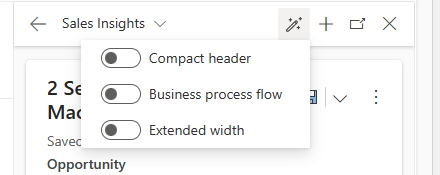
You can then click on a little wand icon to change some of the aesthetics of how the form will be displayed based on your preference.
You can also add activities using the plus button, or click on the menu to get to other controls such as closing it as Won or Lost, recalculating etc.

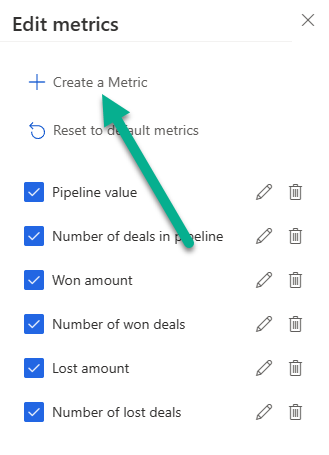
From the top right, click on Combo and you will have the ability to Edit the metrics shown along the top of the Pipeline view.

We can untick metrics to hide them, or delete those that don’t necessarily make sense for your organisation. Really cool that we can also create new metrics.
You can then give it a name, and pick the field to use for the metric. In this we will set the overall budget we know our customers have. You could also add additional filtering criteria to the metric if desired.

Now we can see our new metric, perfect!
One other option is to change the view to look at the Sales funnel which shows us a funnel chart instead, grouping Opportunities by the stage of the Business Process Flow they are in.

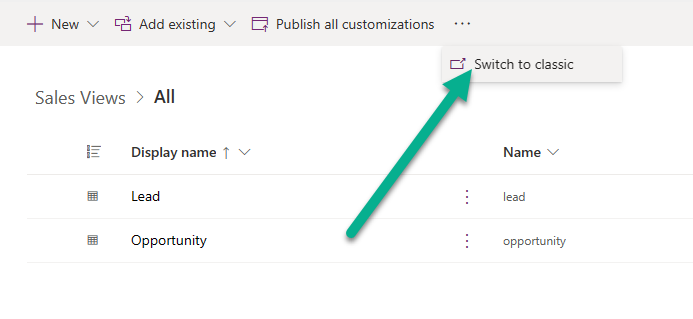
Now if you’ve got to this point and thought, YES I want that! But, you don’t see it in your own environment, your system administrator can easily add it. First thing to know, part of this can only be done in the old classic editor, so from your solution, add your Opportunity table, then switch to classic. Although you can add the control direct to an individual view, providing the ability for people to use on ANY view can only be done in classic at the moment.
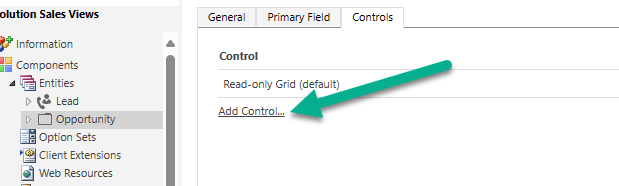
Once in the solution in the classic editor, navigate to the Opportunity table, then click on Controls, then Add Control.
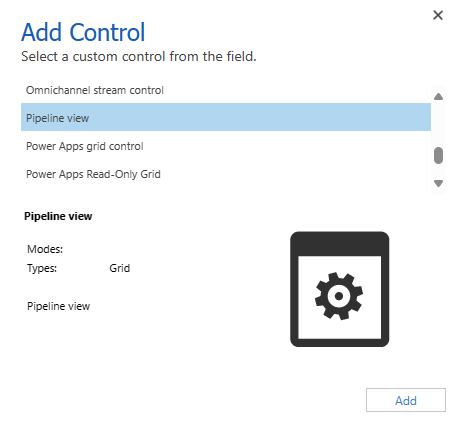
Search for the Pipeline view then add it. I wouldn’t suggest setting it as the default, and leave the Read Only one as the default. That way people can decide if they want to switch to the Pipeline View. Save and Publish the table. There are quite a few options you can change on the view, but suggest you leave them as default to start with, then make changes as you go to see how things look after editing it.
If you DID want to have a view that automatically shows the Pipeline view, open the view (again, easier in Classic at this point), then add the Pipeline view control. This time, set the Web as being the default for this control. No point in doing the others as it won’t show on the mobile app. Click OK, then save the view.

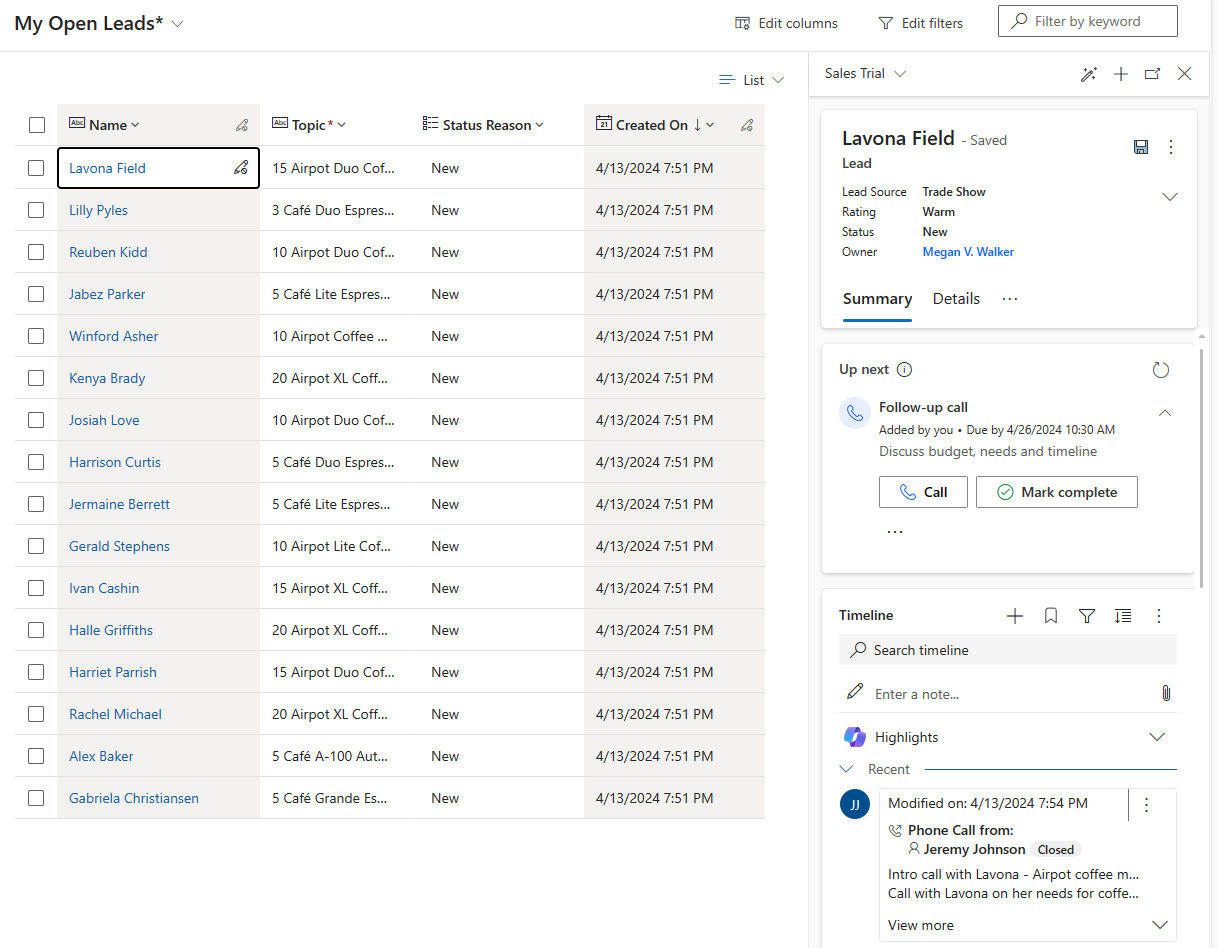
Last thing as some of you are probably as curious as I and wondered, hang on, can I use the Pipeline View on Leads? Well, yes and no. You can add it, and users can switch to it BUT the bubble chart and metrics won’t show at the top. BUT, what will still work is the side panel will open when you click on Leads. So maybe not worth the effort, but now you don’t have to try for yourself. 😉
Check out the latest post:
WordPress Mobile App Issue - Username Password Isn't Associated With This Site
This is just 1 of 455 articles. You can browse through all of them by going to the main blog page, or navigate through different categories to find more content you are interested in. You can also subscribe and get new blog posts emailed to you directly.
Hi Megan,
Thanks for a great post – looks really cool on the Opportunities! It’s a real shame it doesn’t show the graphic for Leads as they go through a business process flow (BPF) as well as Opportunities.
Have you successfully deployed across environments for Pipeline views? I’ve tried for Focused views, but although they can be added to a solution, they don’t deploy. I’ve asked on the forums and the answer was that because they aren’t listed in the Default solution, they aren’t available to actually deploy. Maybe it’s different for Pipeline views?
FYI – The Pipeline view is available for Cases, again, without any graphic even though there’s a BPF for this. I haven’t tried, but maybe it can be set up on any table without the graphic.
Hi Alex! You are welcome. Yeah, I was hoping it would do it based on the fact there were currency fields on the Lead so you could do it based on Estimated Revenue and the presence of a Business Process Flow. Either way, it’s great that it gives you the option to have the side panel without extra configuration. I haven’t deployed across solutions so would be interested to know what happens.
Hi again Megan,
The Pipeline view does deploy. I created a solution with the Case metadata only, added the Pipeline view and Power App Read Only Grid. This imported successfully into the target environment.
I don’t have Sales set up in the environments I have access to so I couldn’t try it out with Opportunities, but I suspect it would only be the control with the settings as set using the classic UI that would be included in the solution, so not the metrics.
Ah you are a star Alex for testing this. And that’s great news that the Pipeline view deploys successfully! And I would guess the same as far as the metrics go as it’s the end user who can interact with that part rather than any settings made on the view control. Good team work! 💪🏼