*** NOTE: ALL INFORMATION IS ACCURATE AT DATE OF PUBLISHING ***
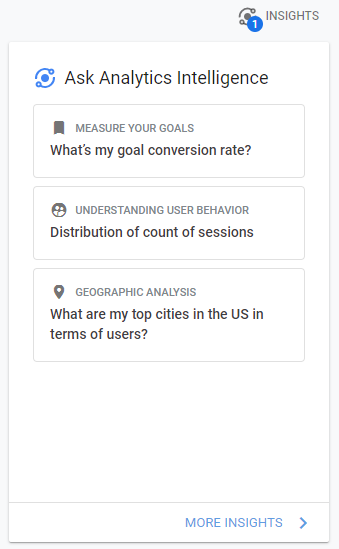
Hopefully, by now, you are starting to use Google Analytics effectively and get a good understanding of the traffic coming to your site, who those visitors are, and where they are coming from. If not…. don’t worry, Google has you covered. A really cool and helpful feature is the Analytics Insights section using Analytics Intelligence. It gives you details on areas you might not have even considered delving in to. You can access insights in a couple of ways but when landing on the Home area, an insights section is displayed at the top right of the main dashboard.
Several insights will be displayed for you. Click on one of them to see the information compiled by Google Analytics based on your data.
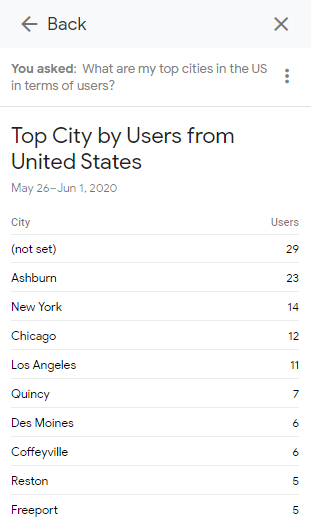
Here we can see an insight showing the Top Cities by Users from the United States.
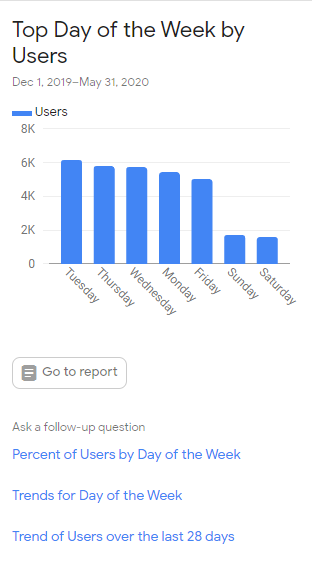
And another one showing the Top Day of the Week by Users, telling me which are the most popular days. This helps to see that posting my content on a Tuesday is likely a good idea, although any other week day would likely be good too. Saturday and Sunday have a big drop off so I’m not likely to post at the weekend. We have an option to Go to a report which will take us to the report that relates most closely to the insight.
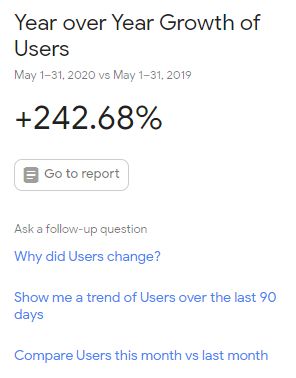
This insight gives us the growth from one year to the next based on the number of users coming to the site. Below the insight we can then ask related follow up questions. So along the same lines, show me the trend for the last 90 days, or compare month to month instead.
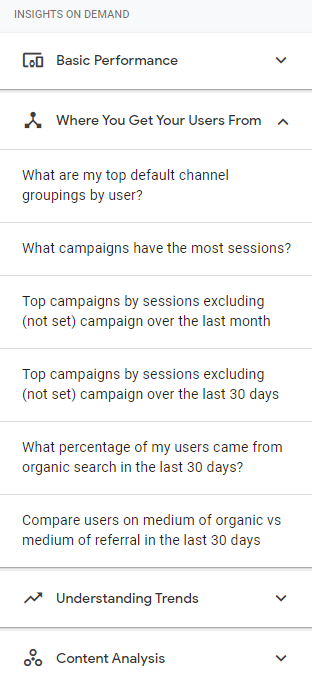
The main insights area gives use question broken up by category. It’s worth navigating through them to find new insights that might be of interest.
We can save an Insight which then shows up in the Saved tab. This is great if we want to go back and review, or save to show others.

Here’s an insight saved from 2019 where the blog page had a spike on a specific day, considered an anomaly in comparison with other days nd the forecasted value.

Another saved insight showing a new record for monthly users.

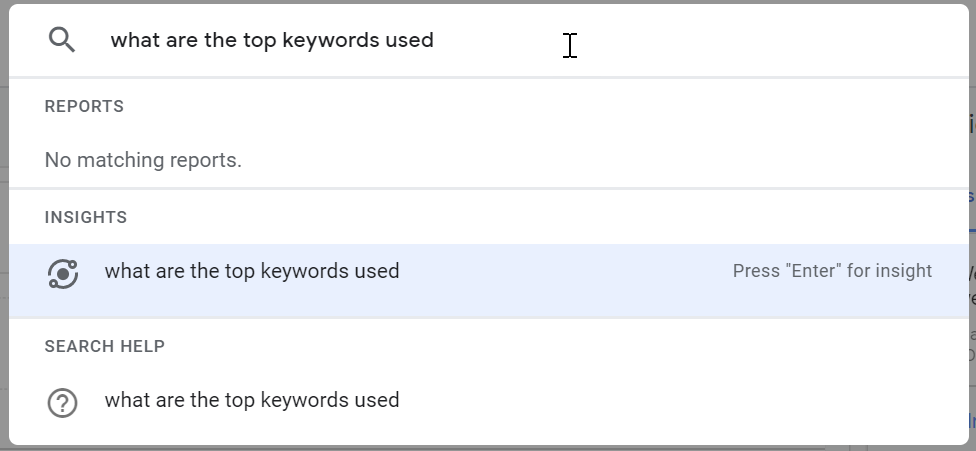
You can also search for insights by typing out a question using the top search box. So what questions do you have about your data? Type them in here, press Enter and start reviewing your own Insights!
Want to just watch how to do this? Check out the video: https://youtu.be/D1gSIMnOiUA
Check out the latest post:
Open Custom Page For Multiple Selected Records In A View Or SubGrid
This is just 1 of 597 articles. You can browse through all of them by going to the main blog page, or navigate through different categories to find more content you are interested in. You can also subscribe and get new blog posts emailed to you directly.