*** NOTE: ALL INFORMATION IS ACCURATE AT DATE OF PUBLISHING ***
You’ve got your Google Tag Manager account set up with your Google Analytics variable, and everything is being tracked nicely. So just who are these people flocking to your website? It’s time to start digging in and getting to grips with the Audience section. What can we find out about them at this point? Let’s take a look.
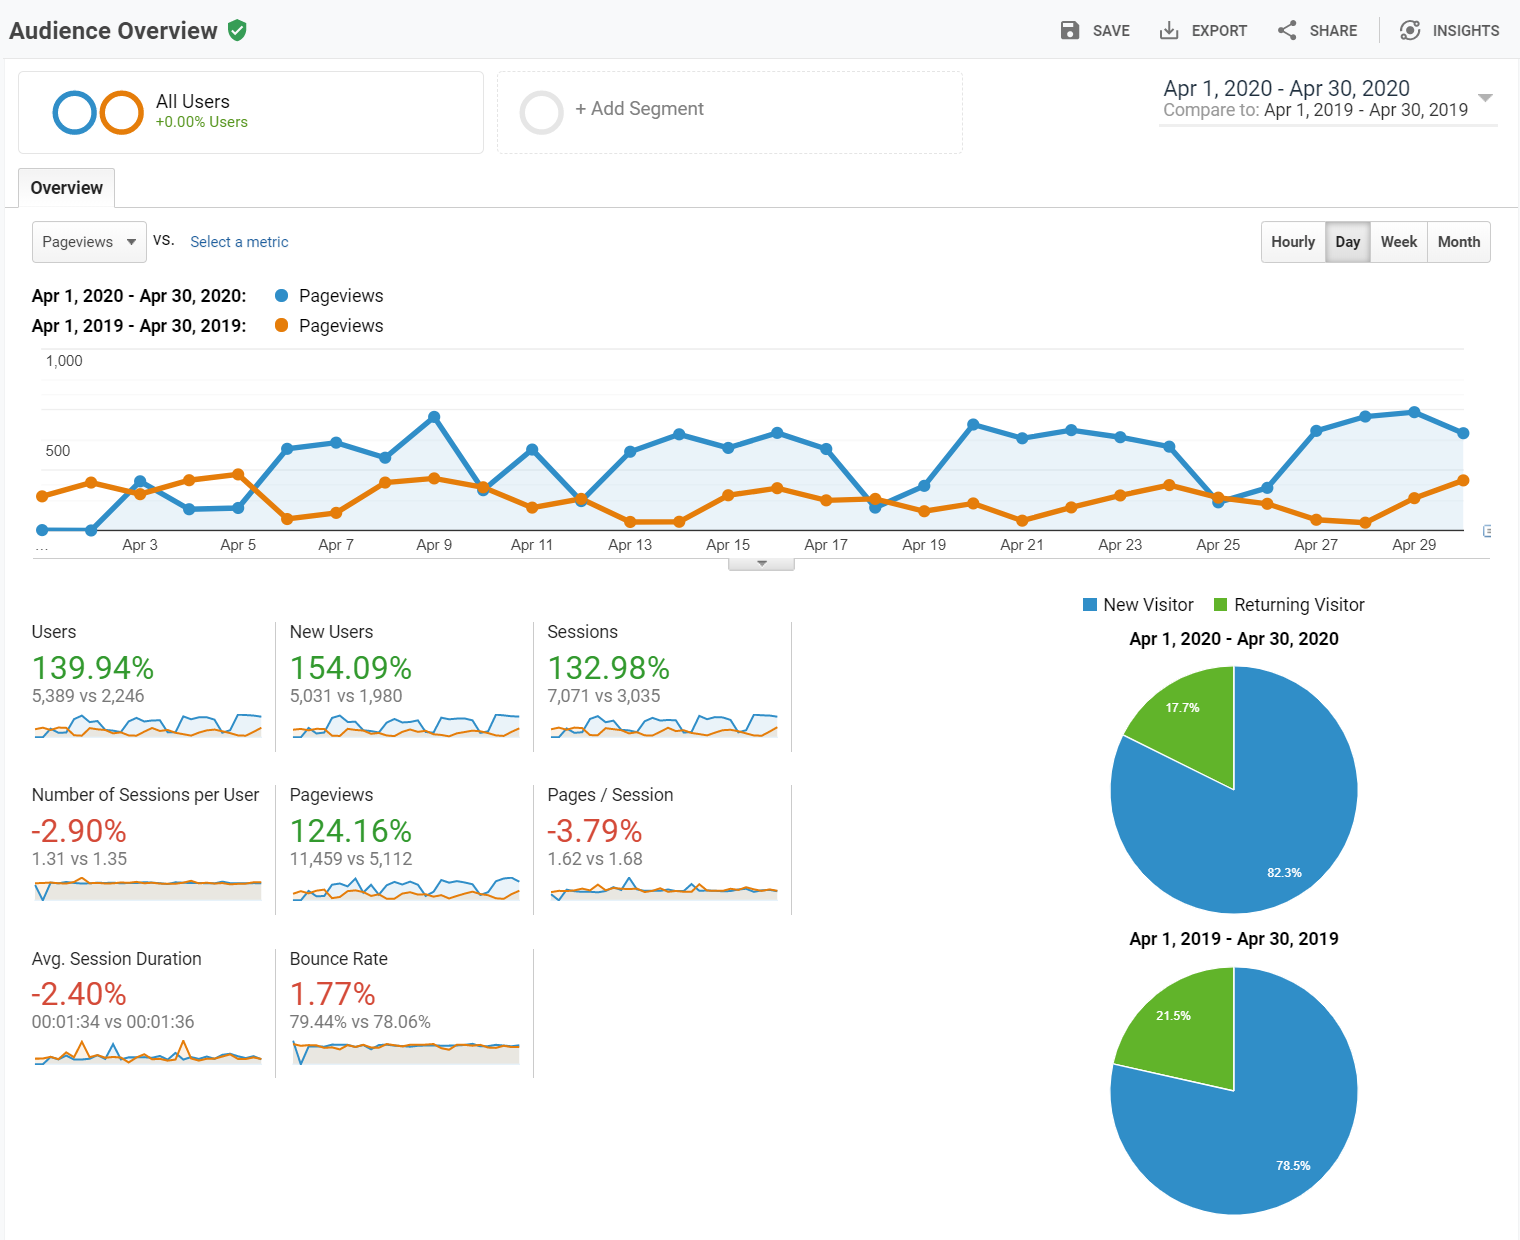
First, we have the Audience Overview. There are many ways you can slice and dice the data. First, use the date control on the right to select the date range you wish to review. You can also choose to do a comparison, so below you can see the line in blue is for April 2020, and the line in orange is for April 2019. We can change data on the line chart, so it’s showing pageviews, sessions or other metrics. Below the line chart, we can see a series of stats and know instantly if it’s an improvement or worse than how we did last year. The two pie charts show the percentage of new visitors compared with the percentage of returning visitors each year. We want a healthy mix of new versus returning visitors. New because we want to draw new readers in, and returning because we want our content to be good enough to have people return time and time again to our site.
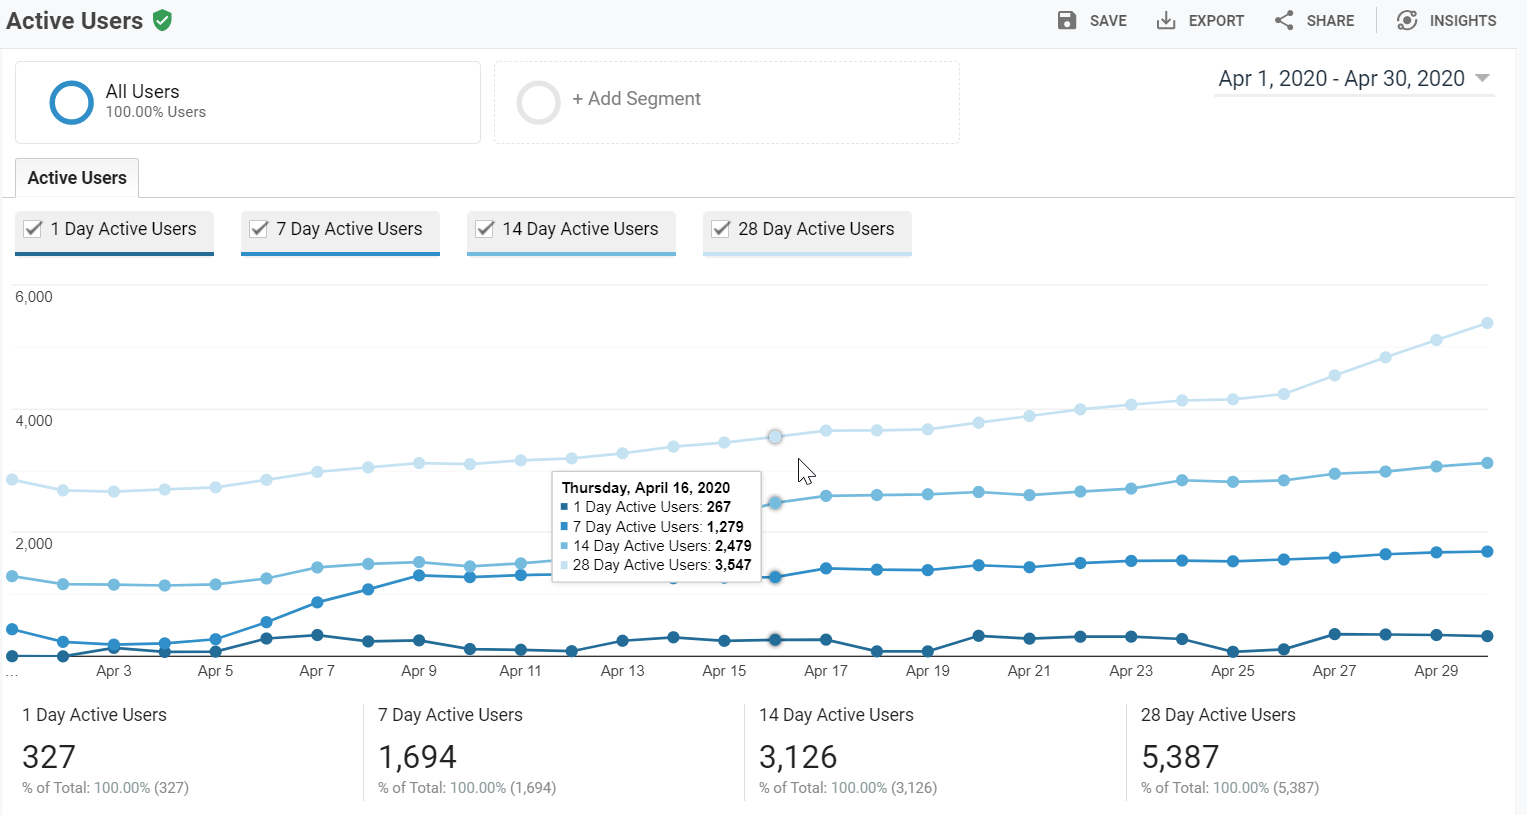
The Active Users section is an interesting one. The metrics are related specifically to the last day that you have in the selected date range. It’s a bit confusing when you first look at it, but here is how it’s broken down.
1 Day Active Users: – the number of unique users who had at least one session within the last day in your active date range.
7 Day Active Users: – the number of unique users who had at least one session within a 7-day period. The 7-day period includes the last day in your active date range.
14 Day Active Users: – the number of unique users who had at least one session within a 14-day period. The 14-day period includes the last day in your active date range.
28 Day Active Users: – the number of unique users who had at least one session within a 28-day period. The 28-day period includes the last day in your active date range.
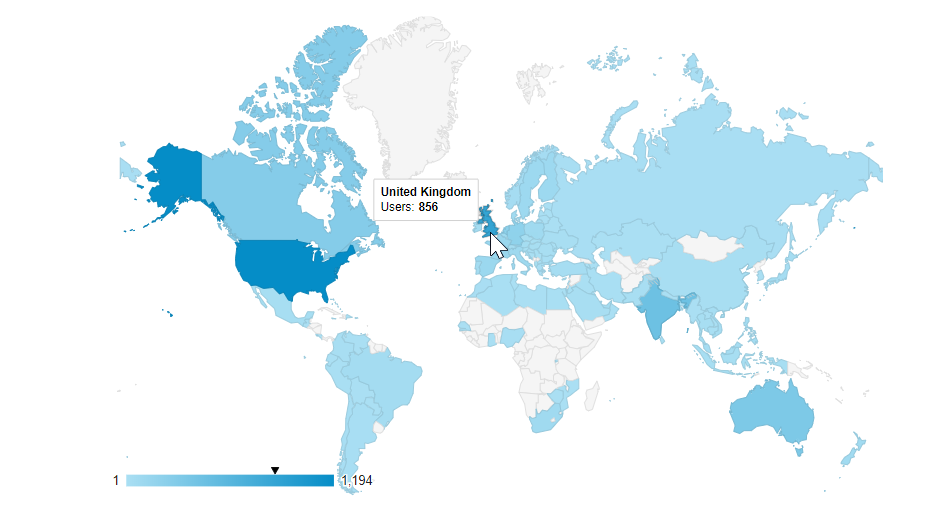
We can also review the audience by Demographic (Age/Gender), Interests (Affinity Category/In-Market Segments), but these may not be of interest to you. We can also view the audience by Geo, for Language and Location (like you see below. The countries can be clicked on to drill down further. Clicking on the USA for example will then show Regions (or States). Clicking on a State will then drill down in to the various Cities. It’s very interesting to see exactly where your visits have come from.
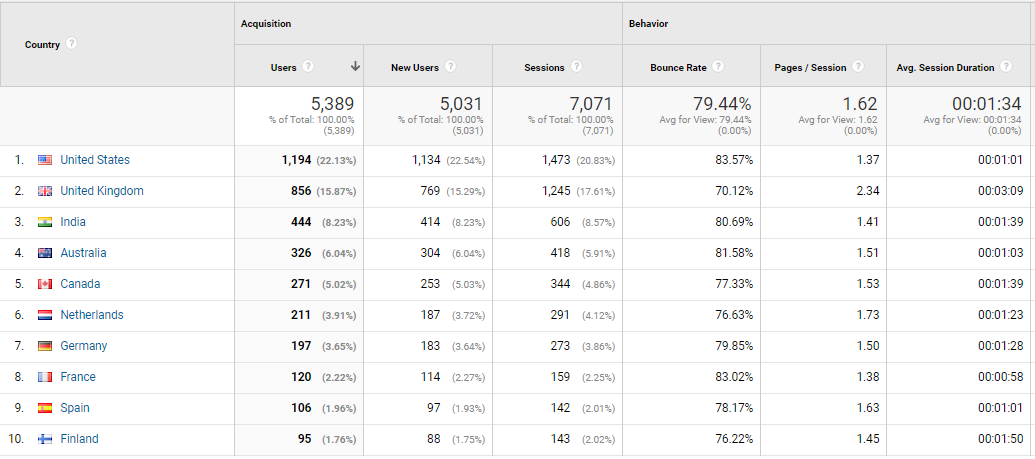
If viewing the Country level, the name will also include the flag icon for that country. We can see the number of users, how many are new users, and the number of sessions. We can also see the bounce rate, average pages viewed per session and the average session duration.
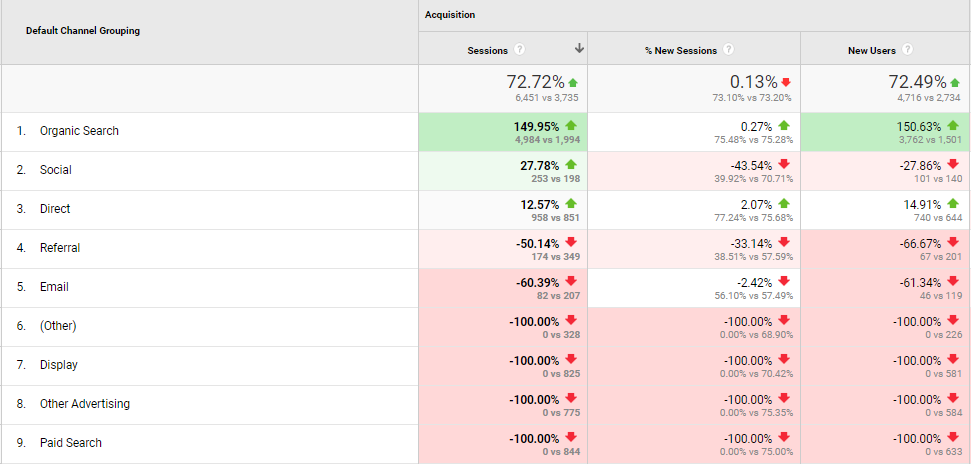
Another interesting snapshot can be found under the benchmarking section and looking at the Channels. This will only work if you’ve enabled benchmarking by sharing your data anonymously with Google and others (the setting is in the Admin area under Account Settings). At the top, an industry vertical will be defaulted in which is the one that Google Analytics thinks most closely matches your business. You can change this to something that you think is more accurate if you wish. Benchmarking allows you to compare your data with aggregated industry data from other companies who share their data. The percent shows the difference between the number of sessions received by the benchmark and the number of sessions received by your website. A positive number indicates that your website outperformed (received a higher number of sessions than) the benchmark; a negative number indicates that your website underperformed the benchmark. You can view benchmarking for Channels (like below), Location and Devices.
There are plenty of areas to dig in to for your audience data. Check out each area and figure out what matters most to you. For me, I don’t really care about the demographics or interests of my site visitors, so I rarely ever look there. It’s about what will tell me something of value, that I can then understand and take action on.
Want to just watch how to do this? Check out the video: https://youtu.be/78cRX9994C4
Check out the latest post:
Create A Segment Using Unmapped Fields On Marketing Forms in Customer Insights Journeys
This is just 1 of 601 articles. You can browse through all of them by going to the main blog page, or navigate through different categories to find more content you are interested in. You can also subscribe and get new blog posts emailed to you directly.