*** NOTE: ALL INFORMATION IS ACCURATE AT DATE OF PUBLISHING ***
In previous parts of this Google Analytics Series, we’ve looked at creating your own custom reports, then importing reports from the Solutions Gallery and setting up custom dashboards. Google has another free tool that we can use to create not only powerful reports but also customise and brand them in ways to fit in with a companies guidelines with logos and colour schemes that work for them. In this post, we will look at how to access Google Analytics report templates in Google Data Studio.
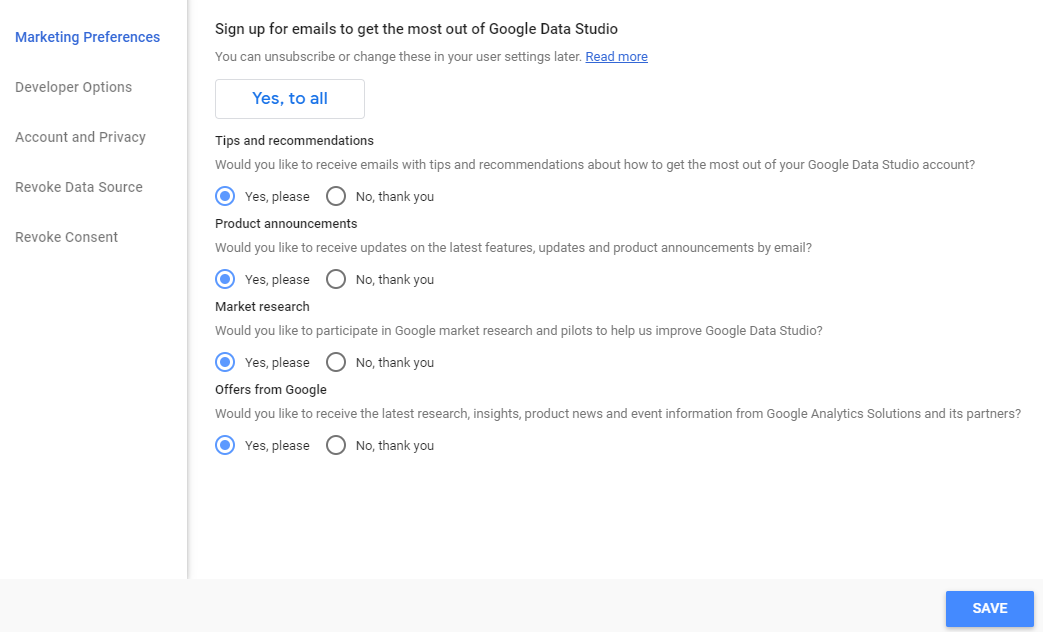
First, go to https://datastudio.google.com/. From there, if you aren’t already, log in to your Google account. If it’s the first time, you’ll be prompted to sign up for emails about the service, so make the choice right for you and save.
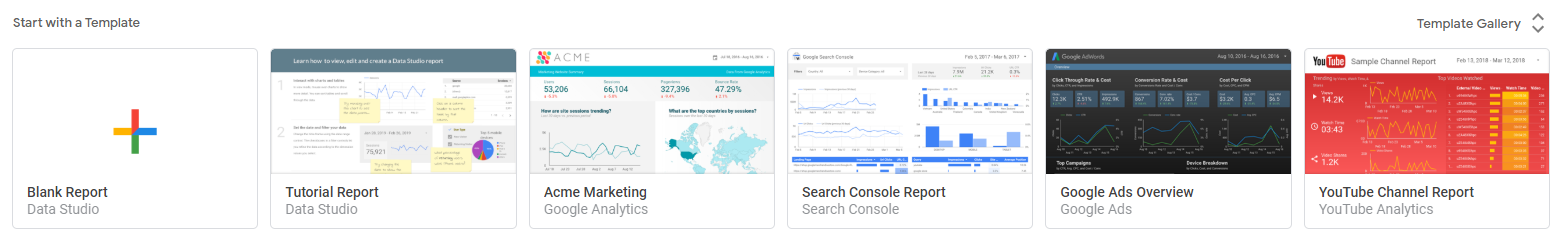
Next you’ll be presented with a bunch of different templates. Underneath the name of the template you will see the data source it’s intended to be used with. We can click on the one called Acme Marketing that’s to be used with Google Analytics.
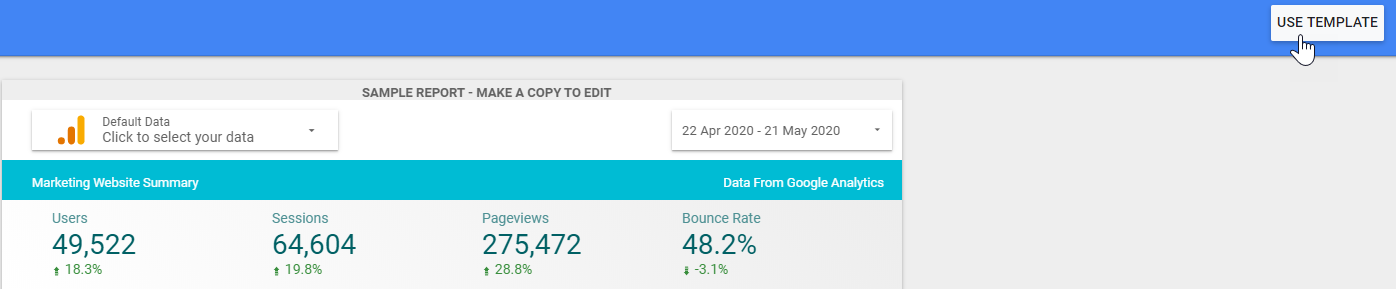
Once the template opens, click on USE TEMPLATE from the top right.
We are now creating a copy of the report. Click to create a new data source.
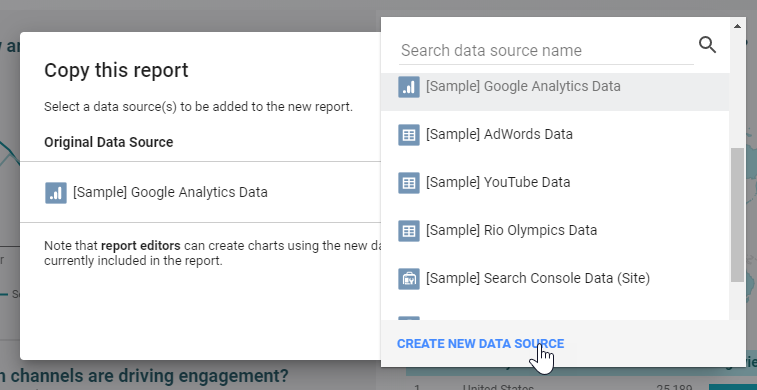
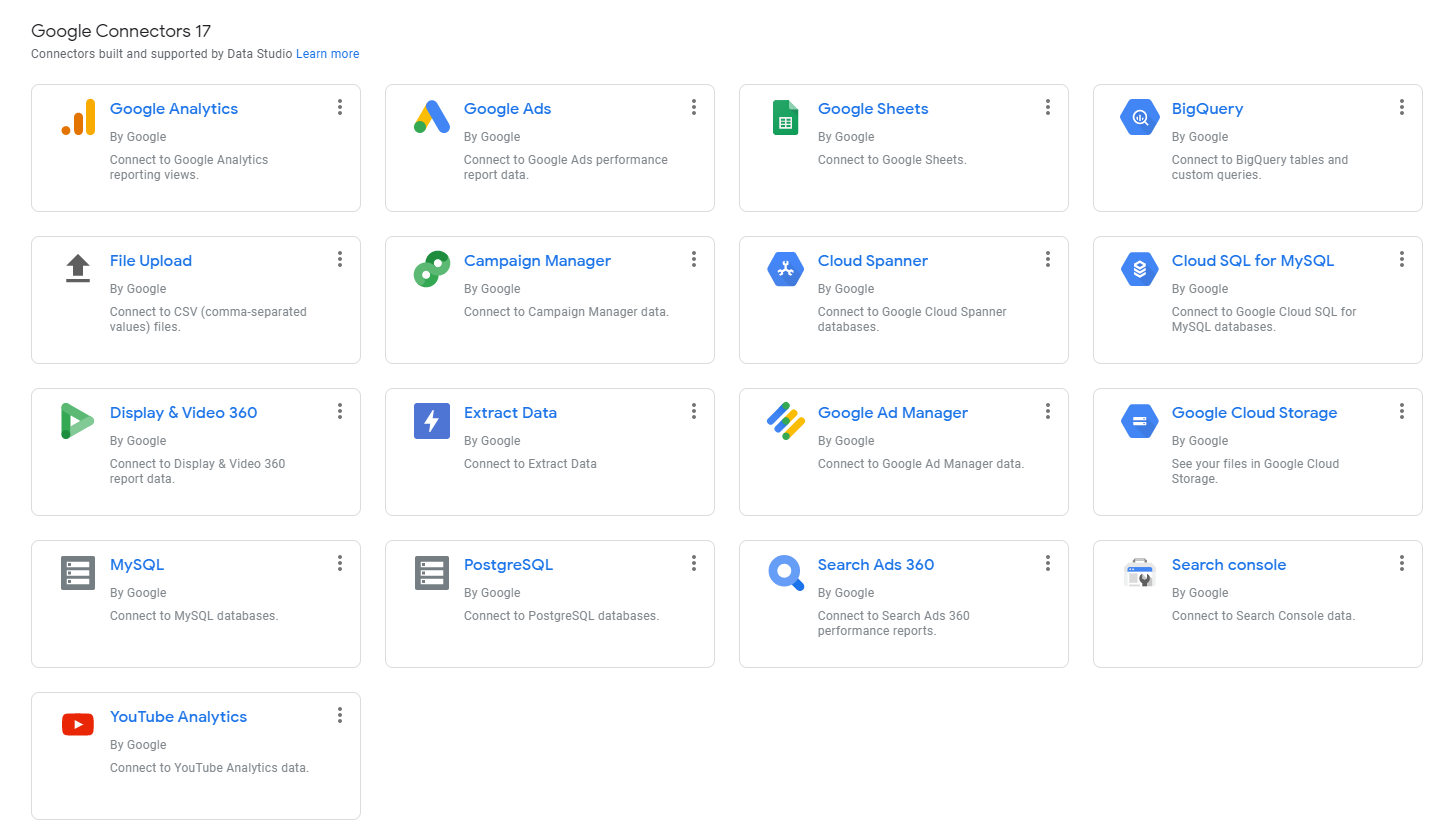
There are a ton of different connectors, with 17 of them being Google connectors. Click on the Google Analytics connector. You’ll then be prompted to select the Account, Property and View you want to connect to.
Once we’ve done that, it will take us back to this screen where we can see the connection we just made as the new data source. Click Copy Report.

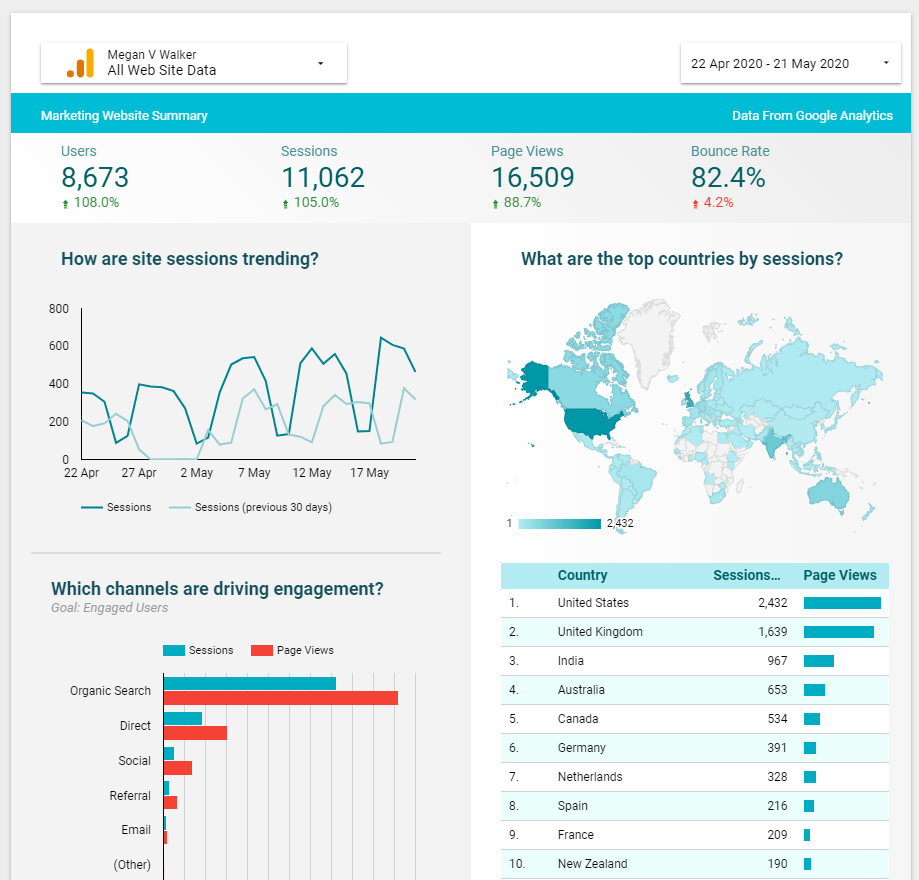
We can now see the report template using the Google Analytics data as the source. It’s as easy as that!
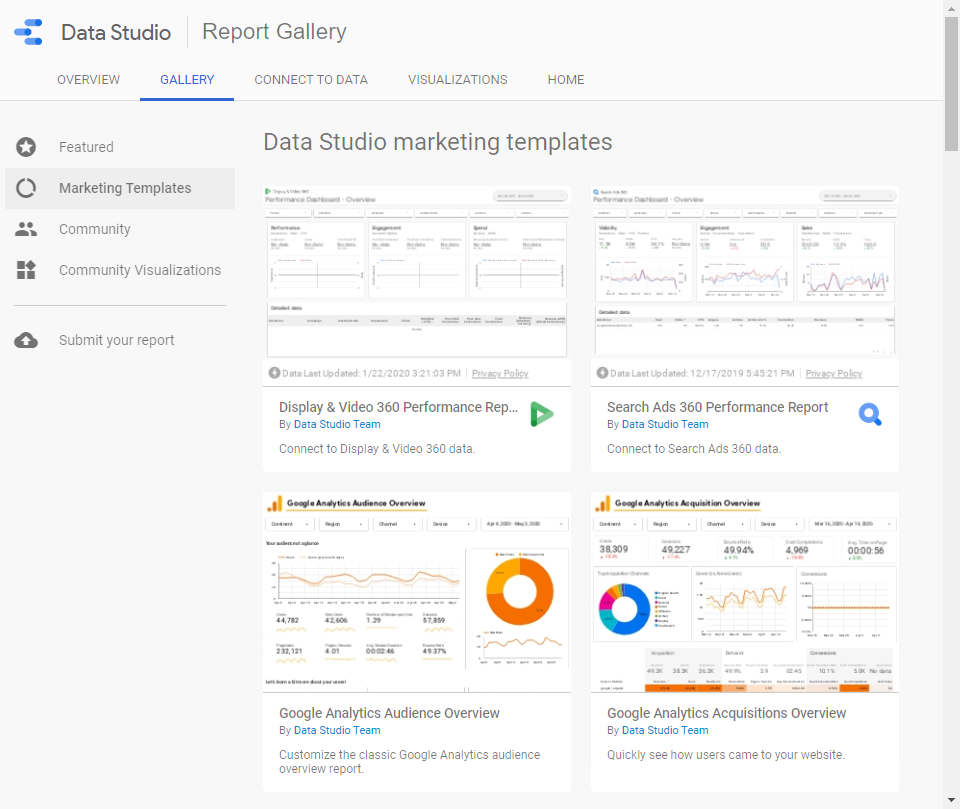
Another option is to go to https://datastudio.google.com/gallery where there are even more options to choose from as a starting point. You can review marketing templates provided by Google Data Studio, or choose something that has been submitted by the community. There are some great options out there.
This one is fantastic from a guy called Mike Goracke who created a Month Over Month Reporting dashboard. To get access to templates like th4eese, simply click on the copy icon, connect to your data source and then copy it.

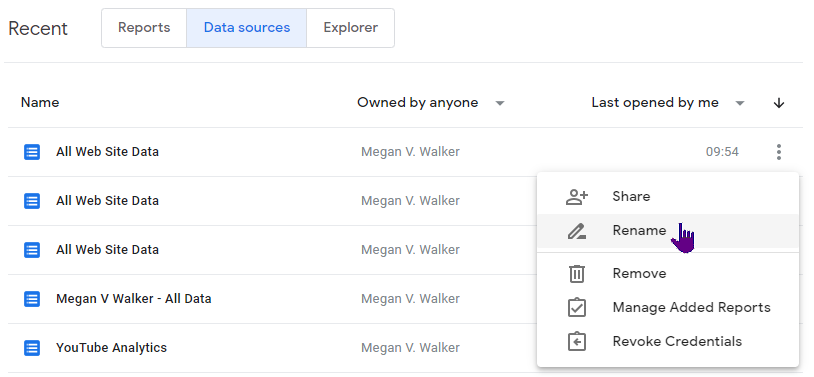
One last thing, after you’ve added your first report, and therefore also added your first data source, go back and find it in the list on the Data sources tab. Make sure you rename it. This is especially important if you manage multiple Google Analytics properties, as you could end up with a bunch of data sources with the same name, making it impossible to know which one you need to link to any future reports.
Want to just watch how to do this? Check out the video: https://youtu.be/EwYtITcewHc
Check out the latest post:
Use Custom Event Registration Questions To Branch Your Journeys In Customer Insights
This is just 1 of 603 articles. You can browse through all of them by going to the main blog page, or navigate through different categories to find more content you are interested in. You can also subscribe and get new blog posts emailed to you directly.