*** NOTE: ALL INFORMATION IS ACCURATE AT DATE OF PUBLISHING ***
So we’ve got Google Analytics tracking code added to our website, and we’ve filtered out our own IP address, and hopefully, we are getting visits to our website (even if it’s just your Dad and your brother to get started with!). One of the sections in Google Analytics that’s kind of the most fun, and can be quite addictive to look at is the Realtime statistics. How many people are on our website, and what are they looking at! Let’s check this out so we can understand what it is we’re being shown.
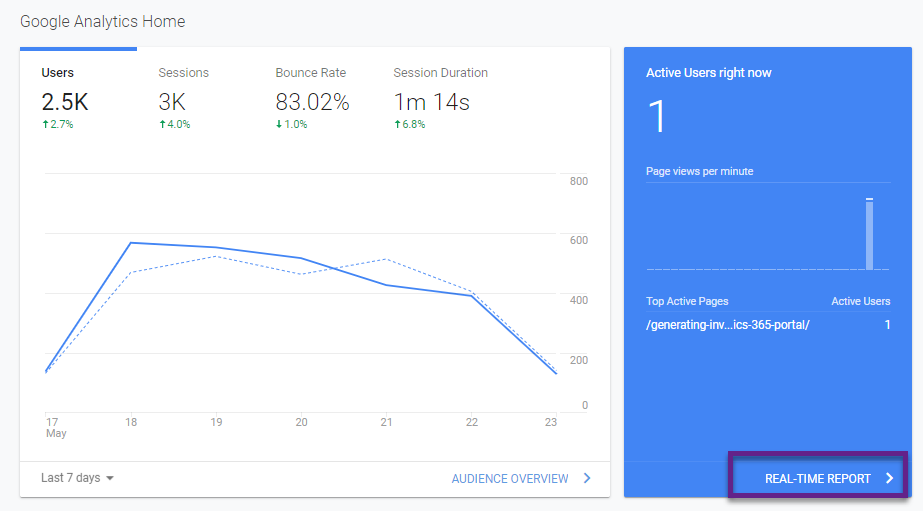
When logged in to our account and are taken to the main landing area, one of the components displays the number of Active Users right now. At the bottom of this section we can click on the REAL-TIME REPORT link to get some details.
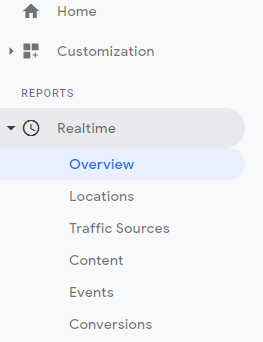
We can also navigate to this area at any time by using the Realtime section on the left navigation menu and clicking on Overview.
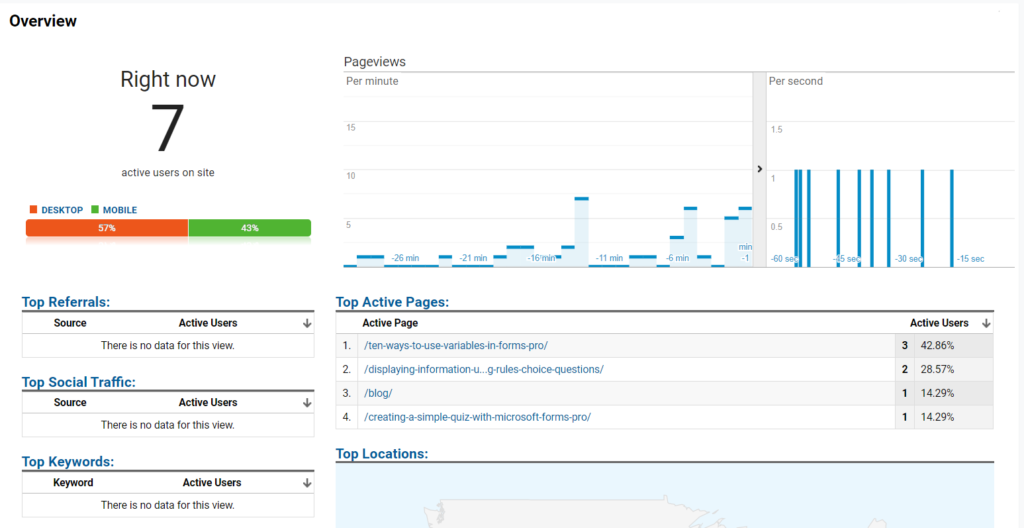
Once in the Overview, we can see some details about the active users currently on the website. Here we can see there are 7 users on the site, and the percentage visiting via desktop vs. those on a mobile device. Some of these sections could be blank like you see below, for referrals, social traffic and keywords. This all depends on how those 7 users accessed the site. The top right section shows the current page views per minute, and then per second. We can then see the top active pages, so which ones are the users viewing.
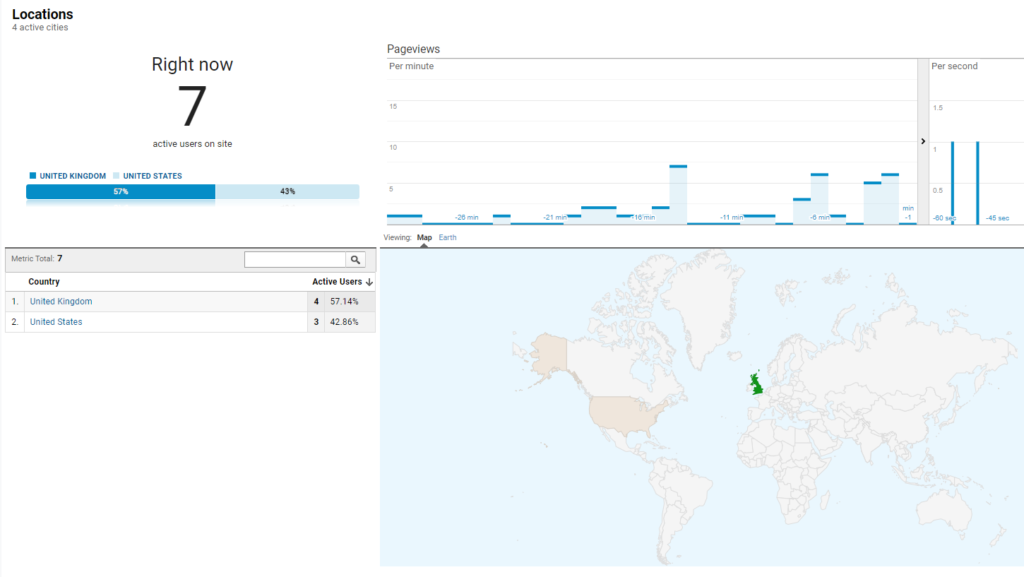
Next in the navigation we can look at locations. Where in the world are the users? In this example 4 of the 7 are in the United Kingdom, and the other 3 are in the United States. This is useful to know where your content is popular or resonating with people. It’s also interesting if you see a spike in a particular area which could happen if a link to one of your posts was just shared by someone else in that same country.
This section also shows you real time stats for traffic sources, events and conversions which we will look at in future posts. The last one of interest is the Content dashboard. We know were the visitors are coming from but what are they looking at? Which of your pages are currently of most interest to people?

The Realtime data in Google Analytics is quite mesmerising at times. It’s great to check out if you’ve just launched a new project or blog post and have shared it on social media. Are you getting immediate traction? It can be quite exciting seeing that number jump up and change in front of your eyes. However, there are times it’s just a big fat zero… and that’s OK too. People obviously need some down time to digest the amazing content they just read on your site, right? ????
Want to just watch how to do this? Check out the video: https://youtu.be/MRz2FKlhqeU
Check out the latest post:
Use Custom Event Registration Questions To Branch Your Journeys In Customer Insights
This is just 1 of 603 articles. You can browse through all of them by going to the main blog page, or navigate through different categories to find more content you are interested in. You can also subscribe and get new blog posts emailed to you directly.